
Fig 7.
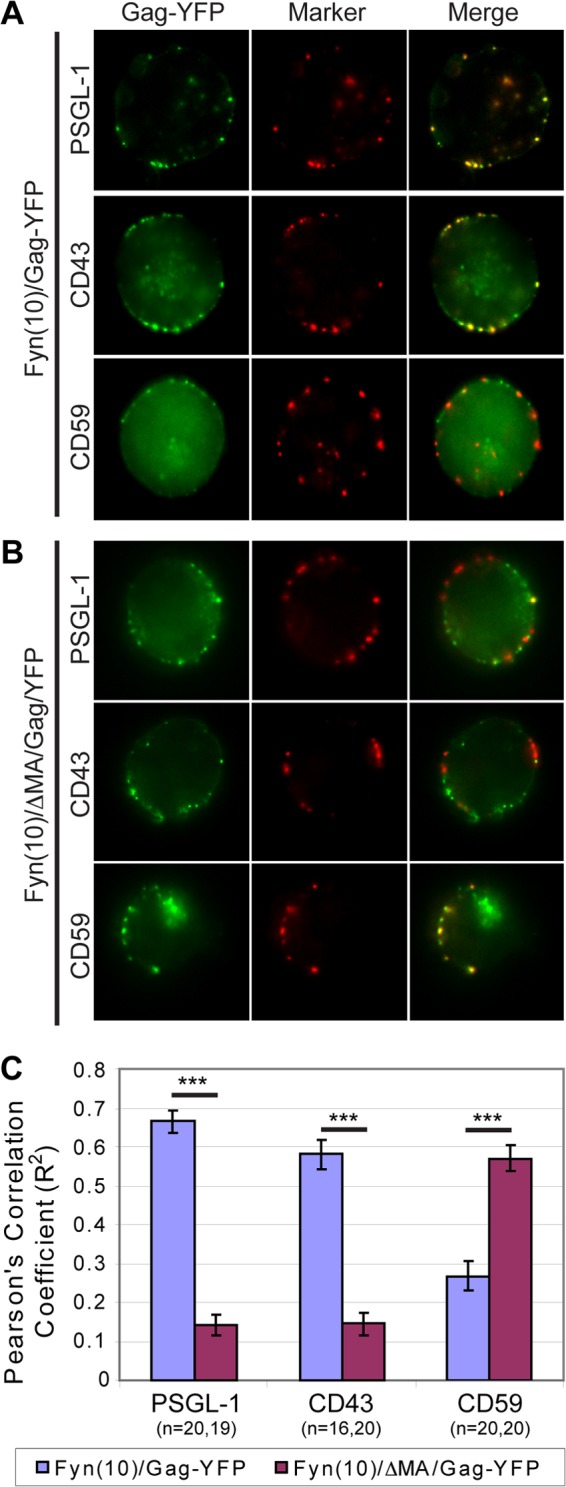
The MA sequence promotes Gag association with specific UDMs. (A and B) P2 cells were nucleofected with molecular clones encoding Fyn(10)/Gag-YFP (A) or Fyn(10)/ΔMA/Gag-YFP (B). After 3 days, cells were immunostained for PSGL-1, CD43, or CD59 before fixation. The middle focal plane of cells is shown. Prominent cytoplasmic signals are observed in some cells. (C) The level of copatching between Gag and uropod markers was quantified with the square of Pearson's correlation coefficient (R2). To ensure that only plasma-membrane-associated Gag was quantified for colocalization, regions of interest corresponding to the cell periphery at the middle focal plane of the cell were used for quantification as described in Materials and Methods. n, the number of cells used for quantification. Error bars represent standard errors of the means. ***, P value < 0.001.