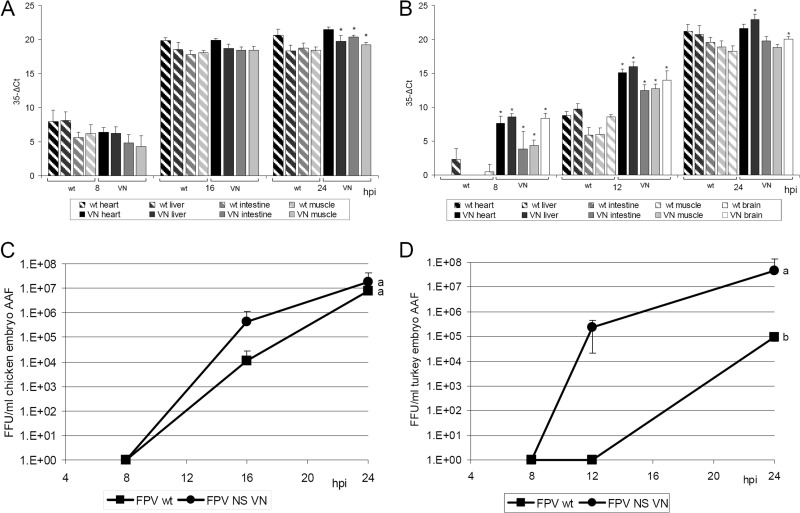
Fig 5.
Virus quantification in intravenously infected embryos of chicken (A and C) and turkey (B and D). Embryos were inoculated with 103 FFU of FPV wt or recombinant VN HPAIV (n = 5/time point). (A and B) Virus quantification in embryonic organs was done with an influenza virus M gene qRT-PCR normalized to 28S rRNA gene expression; CT values were subtracted from 35. (C and D) Amnio-allantoic fluids (AAF) were titrated by a focus-forming assay. Error bars indicate the standard deviations. Asterisks indicate statistically significant differences between FPV wt and FPV NS VN ΔCT values in each organ at the same time point postinfection (P < 0.05; Wilcoxon rank sum test). Different letters indicate statistically significant differences between virus titers (P < 0.05; ANOVA with Tukey HSD).

