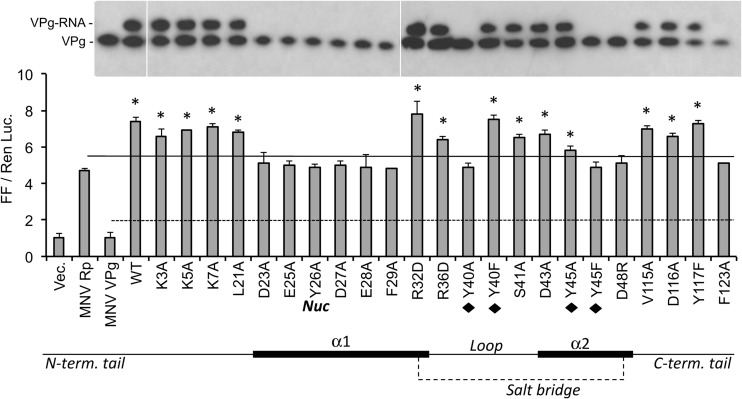
Fig 7.
Effects of mutations on MNV VPg on RNA synthesis by MNV NS7pol. The bar graph shows results from the cell-based reporter assay detecting NS7pol products by the RIG-I innate immune receptor. Each bar contains the results from 3 independent transfected HEK293T cells, and the results are expressed as a ratio of the firefly (FF) luciferase driven by the IFN-β promoter to a constitutive Renilla luciferase (Ren Luc) that was coexpressed within the same cells. Within the bar graph, the solid line represents reporter levels from the NS7pol in the absence of coexpressed VPg. The dashed line denotes the background reporter levels in the absence of RNA synthesis by the NS7pol. Bars identified with asterisks denote results that are statistically different (P < 0.05) from those of the polymerase alone. Under the graph is a schematic representation of key features within the MNV VPg molecule. The thick lines represent the two α-helices in the core, and the bold “Nuc” denotes the location of the nucleotidylation tyrosine. The tyrosines that form a hydrophobic region within the core are identified by black diamonds. The salt bridge between residues R32 and D48 is indicated by a dashed line. The gel images above the graph are from Western blots of immunoprecipitated VPg in cultures tested in parallel to the reporter assay. The identities of VPg and the fractions of the VPg molecules used by the NS7pol for RNA synthesis are shown to the left of the images. All samples were from one experiment but cropped to allow alignment of the Western blot results to those of the reporter assay.

