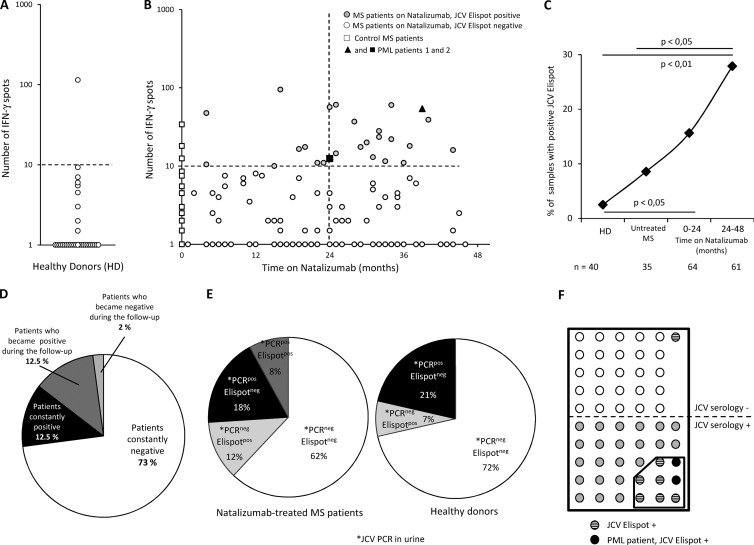
Fig 2.
Increased detection of JCV-specific TEM in patients on natalizumab. Panels A and B represent the number of IFN-γ spots per 0.25 × 10⁶ PBMC after overnight activation with purified JC virus in 40 healthy donors (A) and in 99 MS patients according to the time on natalizumab (B). In panel B, the 2 patients with PML are indicated by a closed triangle and a closed square. The dashed line represents the positivity cutoff (see the text). Panel C represents the percentage of JCV-ELISPOT-positive samples in healthy donors (HD), control patients (Untreated MS), and patients treated with natalizumab for up to 2 years (0–24 months) or more (24–48 months). Some patients treated with natalizumab were tested at 2 or 3 time points. The number of blood samples analyzed is indicated below. Statistical analysis used Fisher's test. Panel D shows JCV ELISPOT results for patients who were tested at 2 or 3 time points. Panel E shows the results of urinary JCV PCR and JCV ELISPOT in 50 MS patients treated with natalizumab and in 14 healthy donors tested with both assays. Panel F shows results of JCV serology and JCV ELISPOT in 56 MS patients on natalizumab tested with both assays.

