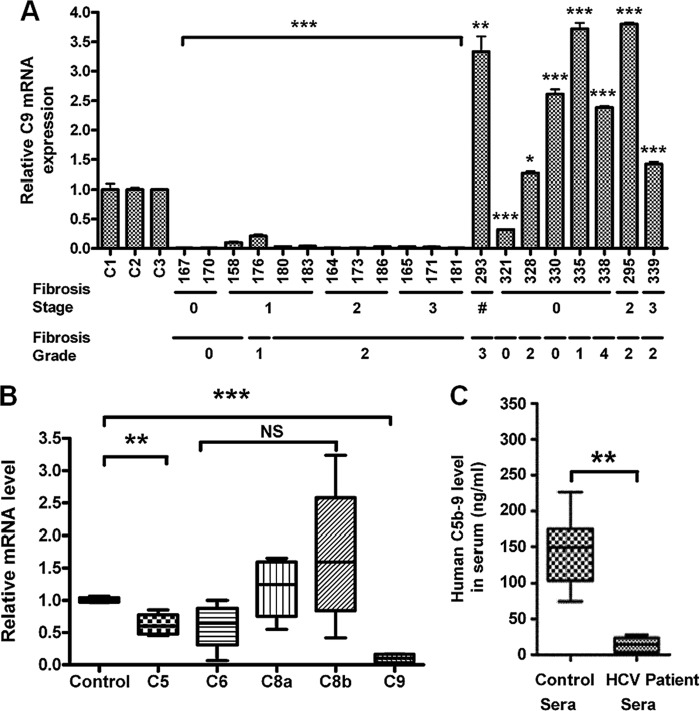
Fig 1.
Repression of C9 mRNA by HCV. (A) Real-time PCR analysis for C9 mRNA expression in 12 chronically HCV genotype 1a-infected liver biopsy specimens (no. 167, 170, 158, 176, 183, 164, 173, 180, 186, 165, 171, and 181), 6 NASH patient liver biopsy specimens (no. 293, 321, 328, 330, 335, and 338), and 2 non-HCV liver disease patient specimens (no. 295 and 339) compared to control human liver RNA. The disease state of patients is shown at the bottom for each liver specimen, excepting one of unknown status with a NASH liver specimen (marked with a crosshatch symbol [#]). (B) Relative mRNA expression of the MAC components in 4 chronically HCV genotype 1a-infected liver biopsy specimens compared to healthy control liver RNA. (C) Comparison of serum C5b-9 levels in the same group of infected patient sera and 10 HCV-negative healthy controls using a commercially available ELISA kit (Quidel). (A to C) *, P < 0.05; **, P < 0.01; ***, P < 0.001 (compared to the control). NS, not significant.

