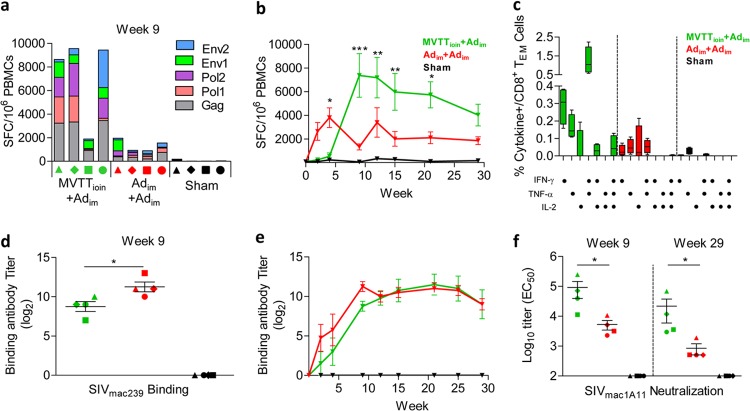
Fig 2.
Immune characterization of the three groups in study I before challenge. (a and b) Temporal comparisons of SIV-specific spot-forming cells (SFC) per million PBMCs as measured by IFN-γ ELISPOT assay. (c) Comparison of percentages of CD8+ TEM cells in peripheral blood that secreted IFN-γ, TNF-α, and IL-2 after stimulation with the SIV Gag peptide pool. (d and e) Temporal comparisons of SIV-binding antibody responses (endpoint titers) against lysed SIVmac239 particles. (f) Comparison of nAb titers against SIVmac1A11 at the peak and 1 week before challenge. EC50, 50% effective concentration. Error bars in panels c to f represent standard errors of the means (SEM). *, P < 0.05; **, P < 0.01; ***, P < 0.001.

