Fig 1.
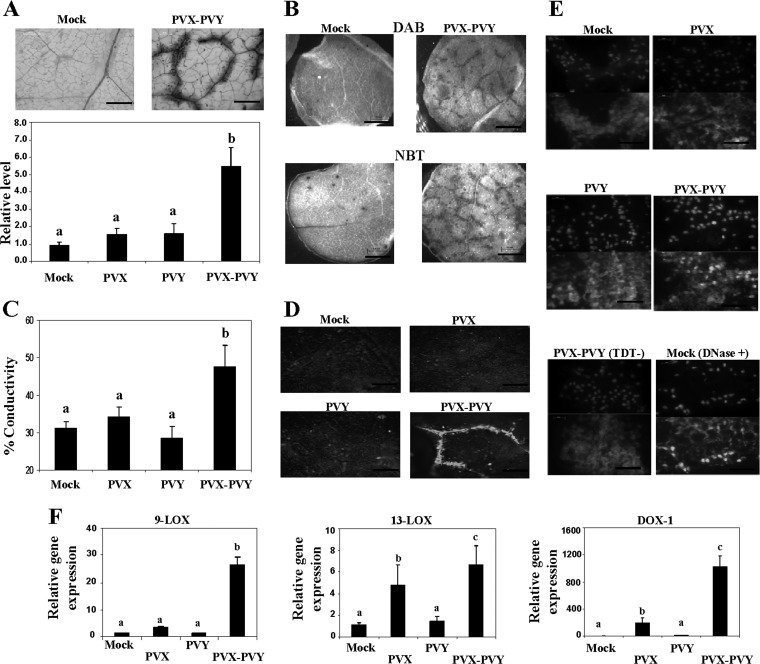
Dead cells and reactive oxygen species in upper leaves of N. benthamiana plants doubly inoculated with PVX and PVY. (A) Leaf discs from plants inoculated with PVX, PVY, or PVX-PVY and from mock-inoculated plants were stained with trypan blue for 1 min and then decolorized in chloral hydrate solution overnight. (Top) Cell death sites could be visualized as a dark coloration in the PVX-PVY sample at 8 days postinoculation (d.p.i.). Scale bars = 0.2 mm. (Bottom) The absorbance of the dye was measured spectrophotometrically at 590 nm using a microtiter plate reader. (B) Leaf discs from plants inoculated with PVX-PVY and mock-inoculated plants were stained with either DAB or NBT solution at 8 d.p.i. O2− production was visualized as a dark blue coloration. DAB formed a deep-brown polymerization product upon reaction with H2O2. Scale bars = 1 mm. (C) Electrolyte leakage from leaf discs of virus-infected plants and mock-inoculated plants at 8 d.p.i. (D) Accumulation of defense-related phenylpropanoid metabolites (gray) was visualized by UV illumination at 8 d.p.i. Scale bars = 0.2 mm. (E) Detection of nuclear DNA fragmentation in plants infected with PVX-PVY. Transferase-mediated dUTP nick-end labeling (TUNEL) assay (lower panels) was performed in leaf sections from PVX-, PVY-, PVX-PVY-, and mock-inoculated plants at 8 d.p.i. Sections of a PVX-PVY-inoculated plant were not treated with the terminal deoxynucleotidyl transferase enzyme (TDT−) as a negative control. Sections of a mock-inoculated plant were treated with DNase I (DNase +) as a positive control. Nuclei are indicated by 4′,6-diamidino-2-phenylindole (DAPI) staining (upper panels). Scale bars = 50 μm. (F) qRT-PCR analysis of expression of the 9-LOX, 13-LOX, and α-DOX-1 genes in N. benthamiana leaves 6 days after inoculation with PVX and PVY. Expression of the 18S rRNA gene served as a control. Data represent the means ± standard errors of three replicates, each consisting of three to five plants that received the same treatment. Statistically significant differences between means were determined by employing Duncan's multiple range test. Different letters indicate significant differences at a P value of 0.05.

