Fig 11.
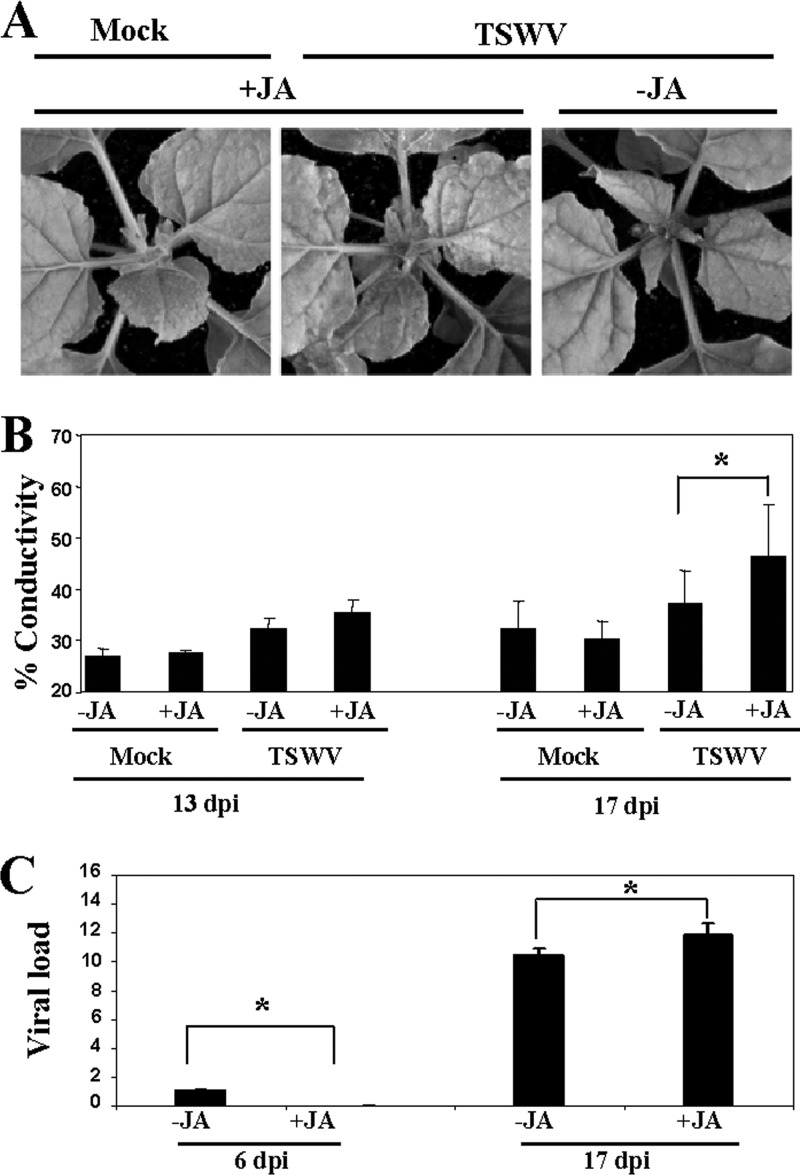
MeJA enhances virulence of TSWV. (A) MeJA (+JA) or mock solution (−JA) as a control was applied to plants that were mock inoculated or inoculated with TSWV. Representative disease symptoms at 17 d.p.i. are displayed. (B) Leaf discs were excised and assayed for electrolyte leakage at 13 and 17 d.p.i. Asterisks indicate significant differences in MeJA-treated plants compared with control plants (Student's t test, P = 0.05). Data represent the means ± standard errors of three replicates, each consisting of three to five plants that received the same treatment. Statistically significant differences between means were determined by employing Duncan's multiple range test. Different letters indicate significant differences at P = 0.05. (C) qRT-PCR was used to analyze the accumulation of TSWV in plants that were treated with MeJA or mock solution and inoculated with TSWV at 6 and 17 d.p.i. Data represent the means ± standard errors. Asterisks indicate significant differences in MeJA-treated plants compared with control plants (Student's t test, P = 0.05).

