
Fig 6.
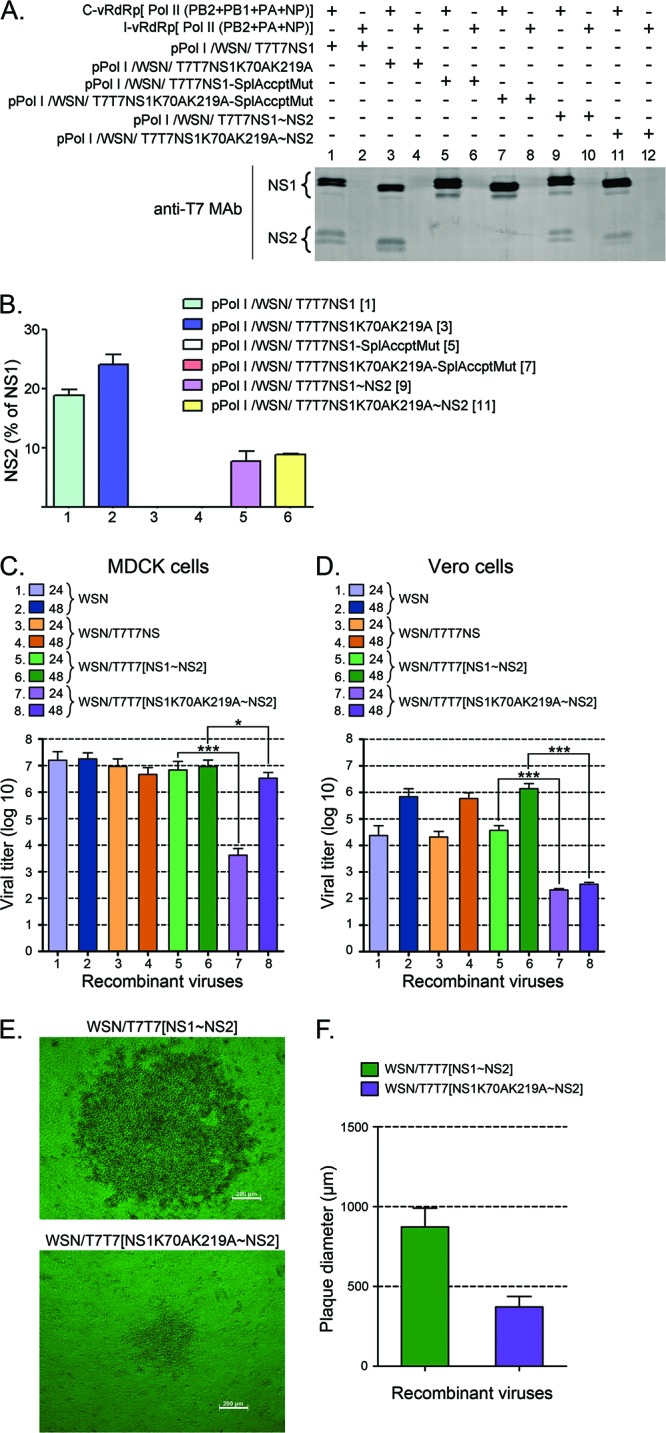
NS1 SUMOylation affects viral growth in MDCK and Vero cell lines. (A and B) Effect of shifting the second exon for NS2 downstream from the stop codon for NS1. HEK293FT cells transfected with (+) or without (−) the indicated plasmids, including a complete vRdRp mix (C-vRdRp), and an incomplete vRdRp mix (I-vRdRp) lacking PB1, were analyzed by immunoblotting with anti-T7 MAb and IRDye 800 CW-conjugated anti-mouse IgG antibodies to determine the levels of NS1 and NS2 expression. (A) Representative immunoblot displaying the data obtained. (B) Quantitative analysis of the percentage of NS2 observed in two independent experiments like the one presented in panel A. The numbers in brackets indicate the corresponding lane in the gel shown in panel A. (C and D) Viral growth of the recombinant viruses developed with the various pPolI/WSN/NS gene segments presented in panels A and B in either MDCK cells (C) or Vero cells (D). All recombinant viruses generated by reverse genetics, including WSN/T7T7[NS1∼NS2] and WSN/T7T7[NS1K70AK219A∼NS2], were purified by two consecutive rounds of plaque purification. Plaques of identical diameter produced during the second round of plaque purification were inoculated over a confluent monolayer of either MDCK cells or Vero cells plated onto 10-cm petri dishes. At 24 and 48 h p.i., the culture supernatants were removed, and their virus titers analyzed by plaque assays. (C) Virus titers obtained with the supernatants collected from MDCK cells. (D) Virus titers obtained with the supernatants collected from Vero cells. (E) Phase-contrast microscopy images of representative plaques for the WSN/T7T7[NS1∼NS2] and WSN/T7T7[NS1K70AK219A∼NS2] recombinant viruses. Bars, 200 μm. (F) Average diameter of the plaques obtained in MDCK cells for the WSN/T7T7[NS1∼NS2] and WSN/T7T7[NS1K70AK219A∼NS2] recombinant viruses by 36 h p.i. The values presented in panels C and D correspond to the data obtained in 3 independent experiments. The values presented in panel F correspond to the average diameters measured for 20 plaques chosen at random from the different plaque assays performed while quantifying virus titers for the different viruses. In all cases, error bars indicate standard deviations. Asterisks indicate P values of 0.05 (*) and 0.001 (***).