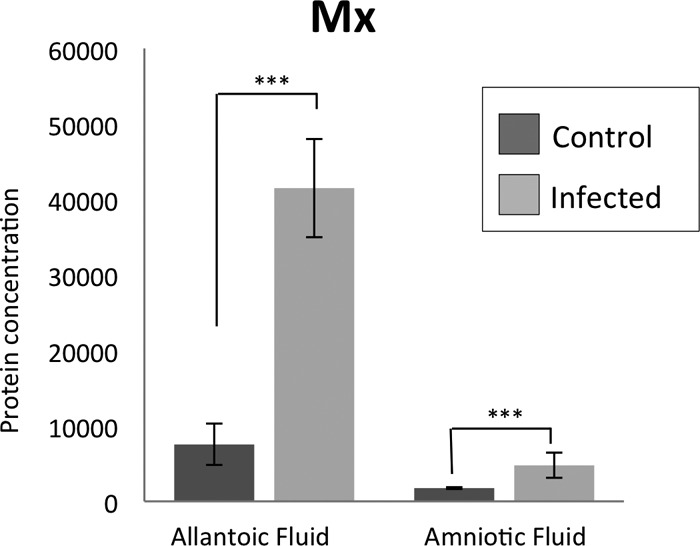
Fig 3.

Relative amounts of ovine Mx1 protein in allantoic and amniotic fluid in control and infected animals. The presented values (y axis) are the relative light units using the Bio-Rad Chemidoc imager and assessed using QuantityOne Image analysis software. The starting protein concentration for the samples from the allantoic fluid was 50 μg and for the amniotic fluid was 12 μg. The data was log transformed for normalization. The infected fetuses had relatively higher amounts of Mx1 protein in the allantoic and amniotic fluid compared to the control fetuses. ***, P < 0.005.
