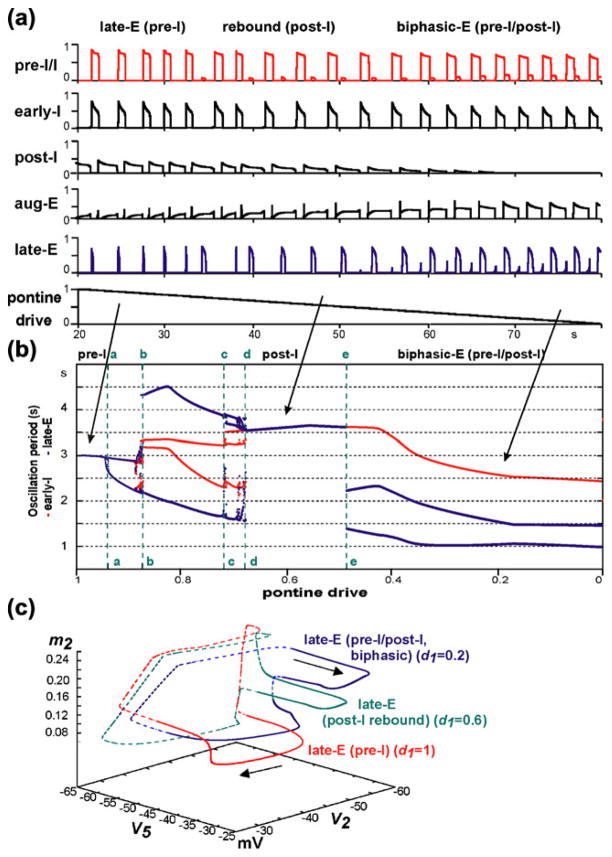
Fig. 7.
Simulation of “hypercapnic hypoxia” conditions. The “hypercapnic” drive was set to d3=0.04 (producing 1:1 coupling between late-E and pre-BötC oscillations, see Fig. 4(a3,b)). (a) Changing model performance with a linear reduction of pontine drive from d1=1 to zero (lower trace) applied to simulate the development of “hypoxia”. With the reduction of pontine drive, the activity of the post-I neuron weakens and, finally, becomes fully suppressed by inhibition from the aug-E neuron. Simultaneously, the late-expiratory burst of the late-E neuron is transformed first to a rebound post-I burst and then to a biphasic-E activity pattern with pre-I and post-I components. (b) Bifurcation diagram showing the periods of late-E neuron and early-I neuron oscillations as functions of pontine drive d1 (indicated on the bottom axis). The diagram shows that with the progressive reduction of pontine drive, the system proceeds through a series of bifurcations indicated by points a–e and the vertical dashed green lines (see details in the text). (c) Trajectories in the (V5,V2,m2) subspace at three levels of pontine drive: unsuppressed (d1=1, red), reduced to 60% (d1=0.6, green), and reduced to 20% (d1=0.2, blue) of the initial value, while the hypercapnic drive to the late-E neuron is held constant (d3=0.04, hypercapnia)

