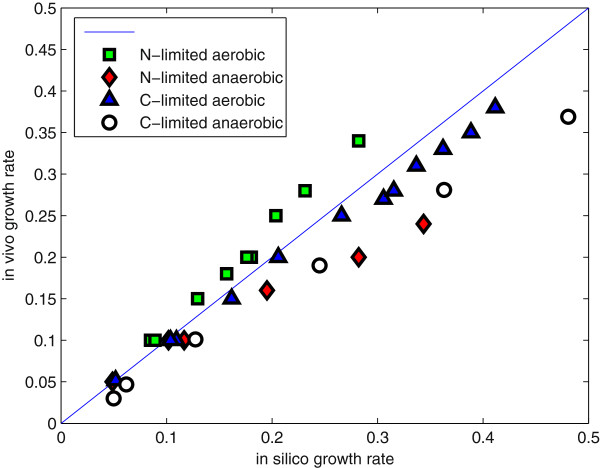
Figure 2.
Model validation by comparing in silico prediction of the specific growth rate with experimental data. Growth phenotypes were collected from literature and compared to simulated values for chemostat cultivations at four different conditions, nitrogen limited aerobic (green) and anaerobic (red), carbon limited aerobic (blue) and anaerobic (white).

