Figure 4.
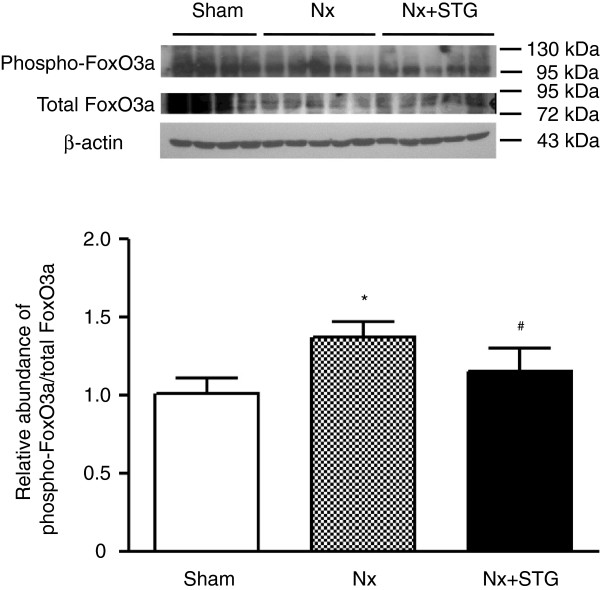
Effects of sitagliptin on FoxO3a phosphorylation. Representative western blot and group data showing FoxO3a phosphorylation in the kidneys of rats from each group. The intensity of the bands corresponding to phospho-FoxO3a was corrected by total FoxO3a levels to obtain relative measures of FoxO3a phosphorylation among all samples. The results are expressed as the mean ± s.d. *Significantly different with respect to the sham-operated rats; #significantly different with respect to the nephrectomized rats; *#P < 0.05. Sham, sham operation; Nx, nephrectomy; Nx+STG, nephrectomy and sitagliptin treatment.

