
Figure 2.
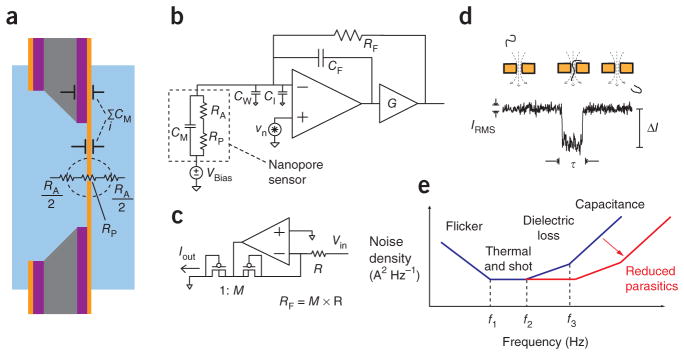
Electrical modeling of a nanopore measurement. (a) An illustration of the electronic impedances of a solid-state nanopore chip. (b) Simplified circuit schematic of the voltage-clamp current preamplifier. (c) Circuit design of the low-noise current source that substitutes for a feedback resistance (RF). (d) An example transient current pulse, characteristic of a single-molecule event such as the one illustrated. (e) Dominant sources of noise power spectral density, illustrated as a function of frequency.