
Figure 5.
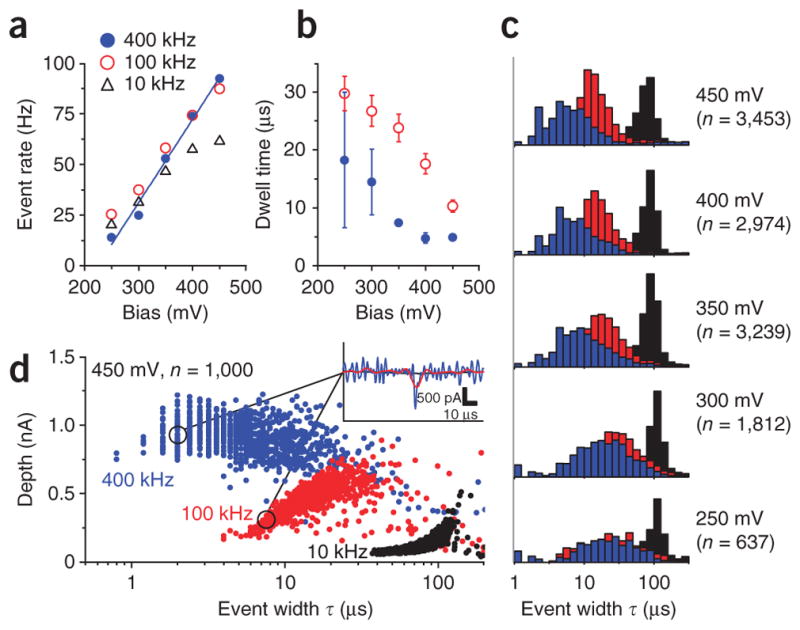
Fast nanopore event statistics (50 bp dsDNA and pore B). (a–c) The CNP output was sampled at 2.5 MS s−1 and then digitally filtered to B = 400 kHz, 100 kHz and 10 kHz signal bandwidths. Event rate as a function of applied bias, for a detection threshold of 5σ (a). Characteristic dwell time τ1 at 400 kHz and 100 kHz as a function of applied potential (b). τ1 was calculated from the width distribution P(τ) = A exp(−τ/τ1) + B exp(−τ/τ2), where τ1 is the shorter time constant18. Error bars, s.e.m. of the fitted parameter (n > 500). Histograms of event widths at applied potentials of 250–450 mV (c). (The listed event count n is for the 400 kHz data. In the 250–300 mV data the heights of the 10 kHz bins were reduced by half for visual clarity.) (d) A scatter plot of events from a subset of the 450 mV data at the three bandwidths. Brief events were severely distorted and attenuated by lower bandwidths. Inset, representative event in the 450 mV dataset. The event was notably distorted at 100 kHz, and undetected at 10 kHz.