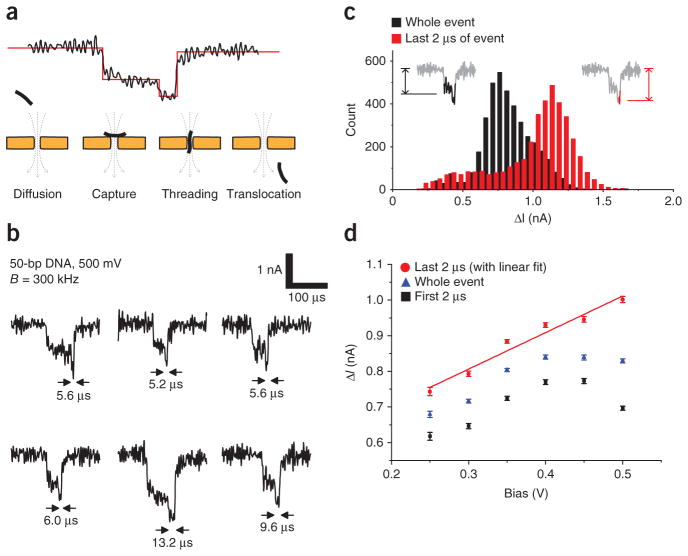
Figure 6.
Intra-event structure. (a) An illustration of the sequential processes of translocation for short oligomers and small nanopores. (b) Typical signals observed for 50-bp dsDNA fragments with pore B (d = 3.5 nm) at 500 mV bias. (c) A histogram of event depths (ΔI) for 50-bp DNA at 500 mV bias (n = 3,955 events). The depth of the whole events and the depth of the last 2 μs of each event have distinct distributions. (d) A plot of the mean depths of the whole events, along with the mean depths of the first and last 2 μs of each event (error bars, s.e.m, n > 500). The depth of the last 2 μs retained a linear relationship with voltage up to 500 mV, whereas earlier portions of the events became shallower at high bias. This may be indicative of molecular dynamics at high electric fields which suppress polymer diffusion and extend the duration of the ‘capture’ phase relative to the ‘threading’ phase.

