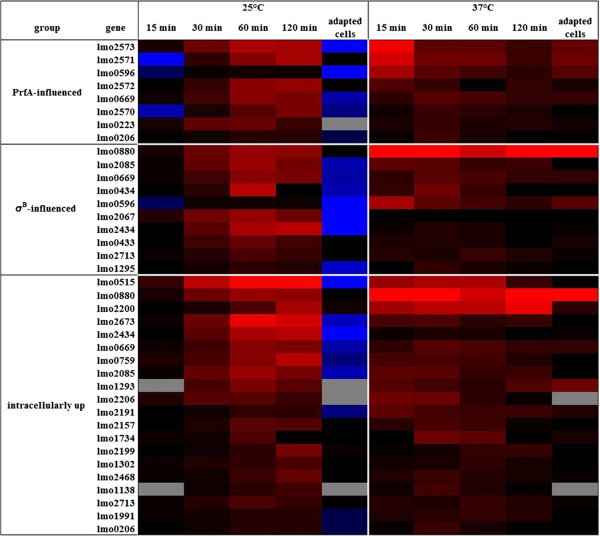
Figure 4.
Heat map of genes influenced by PrfA or σB, or of intracellularly induced genes. Average expression of in vivo-relevant expression after acid shock at 25°C and at 37°C. In both experimental settings, samples were taken 15, 30, 60 and 120 min after acid shock, and from acid-adapted cells. Genes have been grouped according to their putative regulation by PrfA and σB, as well as to up regulation during intracellular growth. Up regulation is colored in shades of red, down regulation in shades of blue. “No change” is indicated by black and missing values by grey coloring.

