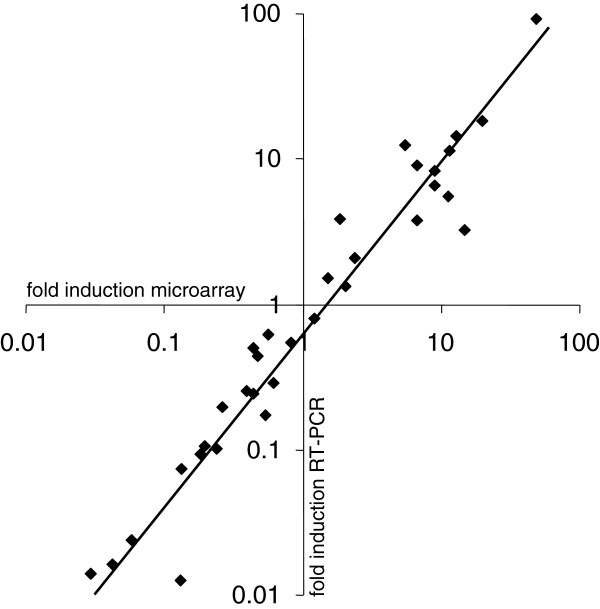
Figure 5.
Correlation of microarray data and qRT-PCR analysis of selected genes. The following genes were selected for microarray validation by qRT-PCR: prfA, hly, flhB, cheA, lmo0109, lmo0847, lmo1740, rsbR, lmo1389, lmo1997, lmo2434, and lmo2784 (see Additional file 3 for more functional details). The validated genes checked at various time points (♦) displayed a significant correlation (level of correlation = 0.966) between the data obtained by microarray analysis and by qRT-PCR. Three independent qRT-PCR experiments were performed.

