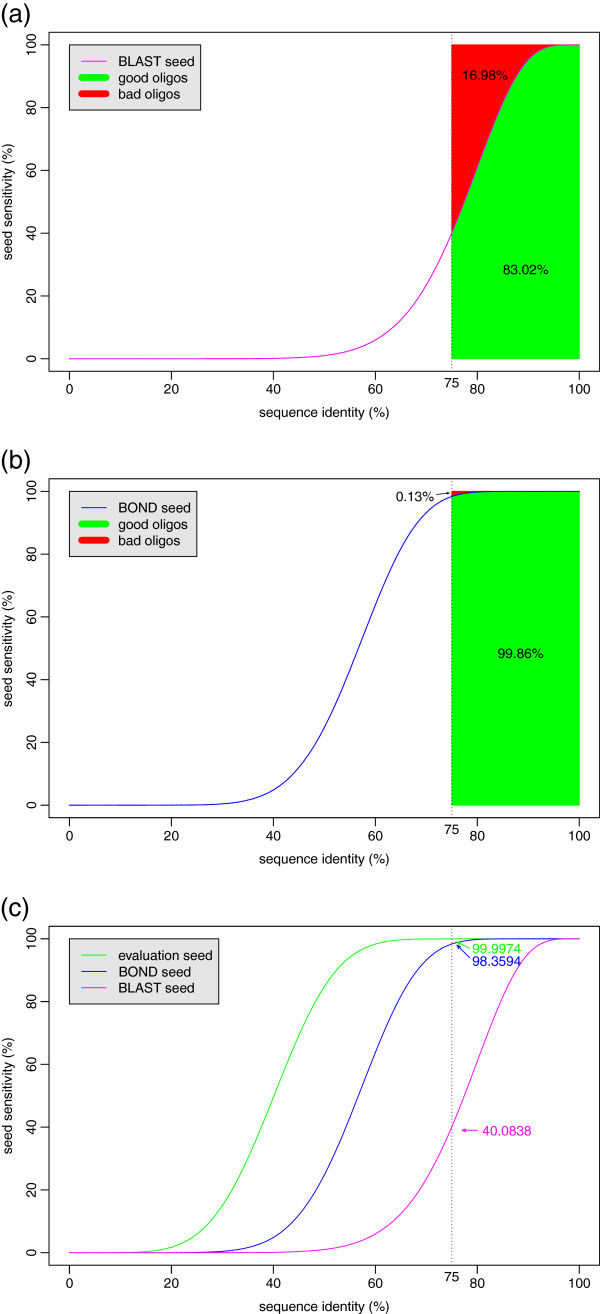
Figure 1.
Seed sensitivities. The sensitivity of three seeds: (a) BLAST’s seed (used by most software programs), (b) BOND’s seed, and (c) evaluation seed (used in our evaluation procedure) are plotted against sequence identity. The red area above the curves in (a) and (b) shows the oligos that have identity 75% or more with non-targets but are not identified by the seed, whereas those inside the green area are identified by the seed. BLAST’s seed fails to identify 16.98% of bad oligos whereas BOND’s seed only 0.13%. The sensitivity of all three seeds are shown in the (c) plot, where their sensitivities at 75% sequence identity are shown; BLAST’s is only 40%. In all plots the length of oligos is assumed to be 50.

