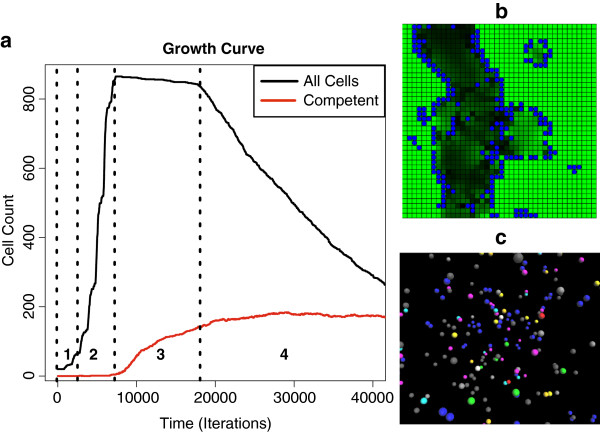
Figure 3.
Bacteria growth curve generated by the model. a) Bacteria growth curve generated by the model with distinct phases labeled corresponding with known bacterial growth phases: 1-lag phase, 2-exponential growth phase, 3-stationary phase, and 4-death phase. b) This is a view of the cell culture model where nutrient counts are shown in green and cells in blue. Dark patches show regions where nutrients have become depleted due to consumption by cellular agents. c) Agents are shown interacting inside the intracellular model.

