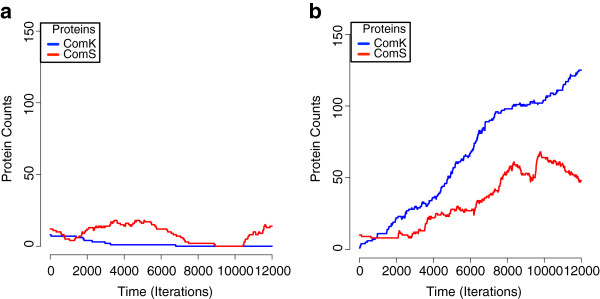
Figure 5.

Identical initial parameters result in two distinct phenotypes. This figure shows two simulations of the intracellular model with the only difference between them being the random spatial placement of agents in the 3-D grid. a) ComS production exceeded ComK and competence did not occur. b) In a small percentage of simulations (see text), ComK production exceeded ComS and drove its own positive feedback loop resulting in competence.
