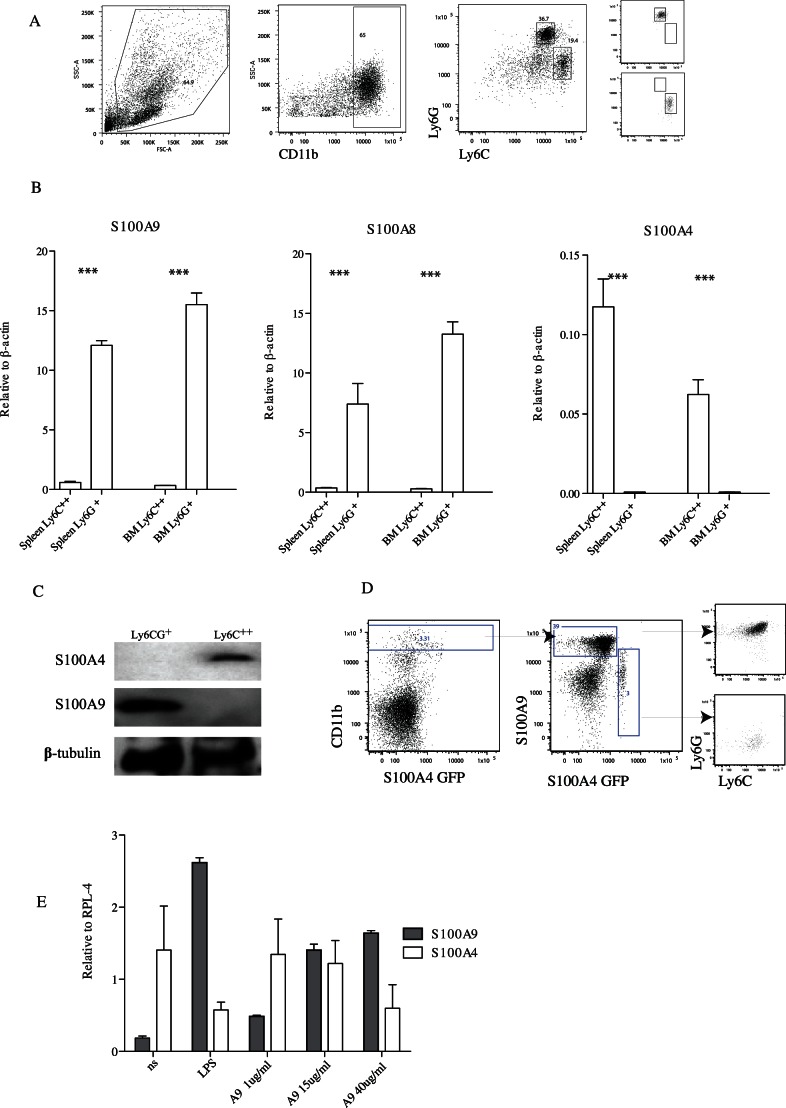
Figure 6. Analysis of S100A9 and S100A4 expression in vivo.
FACS sorting of spleen cells from C57BL/6 animals. Panel A: Left: The gate used for defining CD11b+ cells is shown. Right: The CD11b+Ly6G+C+/CD11b+Ly6C++ populations used for comparison and defined as indicated. Purity is shown to the far right. Panel B: Quantitative real time RT-PCR analysis of S100A9, S100A8 and S100A4 RNA expression from indicated cell populations (>90% pure by FACS analysis) from the spleen and BM of C57BL/6, animals. The mean expression from 4 separate experiments is shown (*** = p<0.001; Students unpaired t test). C. FACS Aria sorted cells were used for Western blotting. Antibodies to S100A4, S100A9 and β-tubulin were used to reveal respective protein. Panel D. Indicates the gating strategy on S100A4 GFP mice on C57BL/6 background. E. Quantitative RT-PCR analysis of S100A4 and S100A9 expression from THP-1 cells cultivated alone or for 48 h with LPS or S100A9, as indicated. Two independent experiments with triplicate cultures were performed.

