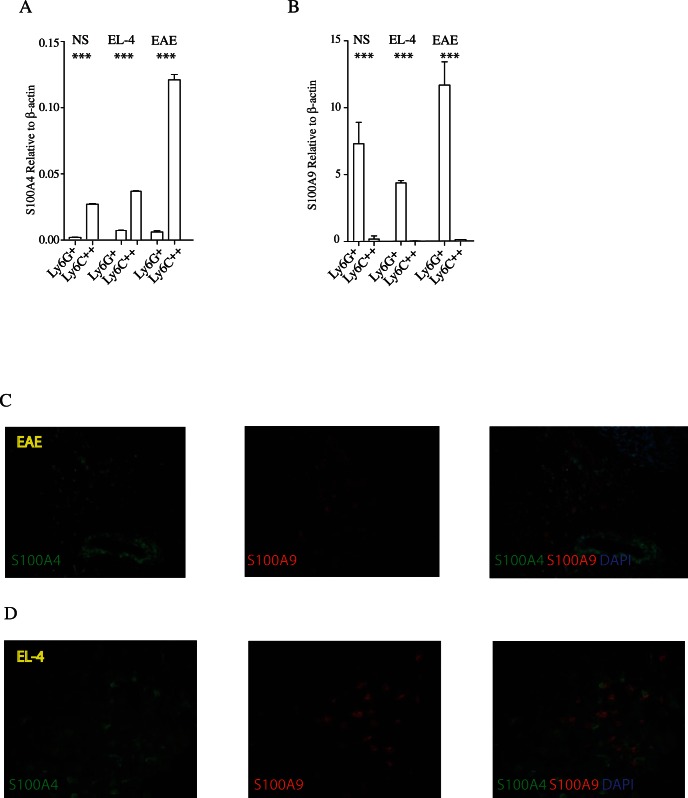
Figure 7. Analysis of S100A9 and S100A4 expression in vivo during disease.
Panel A and B; Quantitative real time RT-PCR analysis (see Materials and Methods). Spleen cells, from control C57BL/6 animals, from mice inoculated with 50,000 EL4 lymphoma cells or spleen cells from EAE induced animals with MOG-peptide and with Pertussis toxin were FACS-sorted and used to analyze RNA expression of S100A4 (Panel A) and S100A9 (Panel B) (*** = p<0.001; Students unpaired t test). Panel C; Immunohistochemical analysis show cells expressing S100A4 (green), S100A9 (red) in brain sections from mice with MOG induced EAE. The labeled cells are localized close to and around a vessel. An overlay of the two first pictures including nuclear staining of DAPI (blue) is shown in the last picture. Scale bar represents 100 µm. Panel D; Expression of S100A4 (green) and S100A9 (red) respectively in sections from an EL-4 tumor. An overlay of the two first pictures including nuclear staining with DAPI (blue) is shown in the last picture. The overlay shows that S100A4 and S100A9 is expressed in different cells, no overlap can be detected. Scale bar represents 50 µm.

