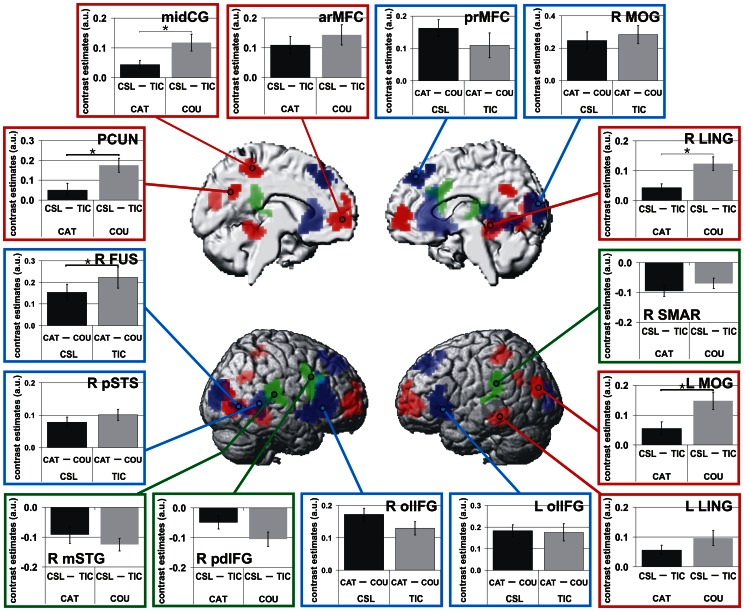
Figure 2. Laughter type- and task-dependent cerebral responses defining ROIs for connectivity analyses.
Increased responses to complex social laughter types (CSL>TIC, red), to tickling laughter (TIC>CSL, green) and during explicit processing of social information of laughter (CAT>COU, blue) (p<0.001, uncorrected, cluster size k≥55 (CSL vs. TIC) and k≥54 (CAT vs. COU), corresponding to p<0.05, FWE corrected at cluster level). Panels depict mean contrast estimates extracted from activated regions. Please note that displayed effects are relative contrasts and do not correspond to general hemodynamic activations or deactivations. Asterisks mark significant interactions (p<0.05) between laughter type (CSL/TIC) and task (CAT/COU). Activations are rendered on an MNI standard brain.

