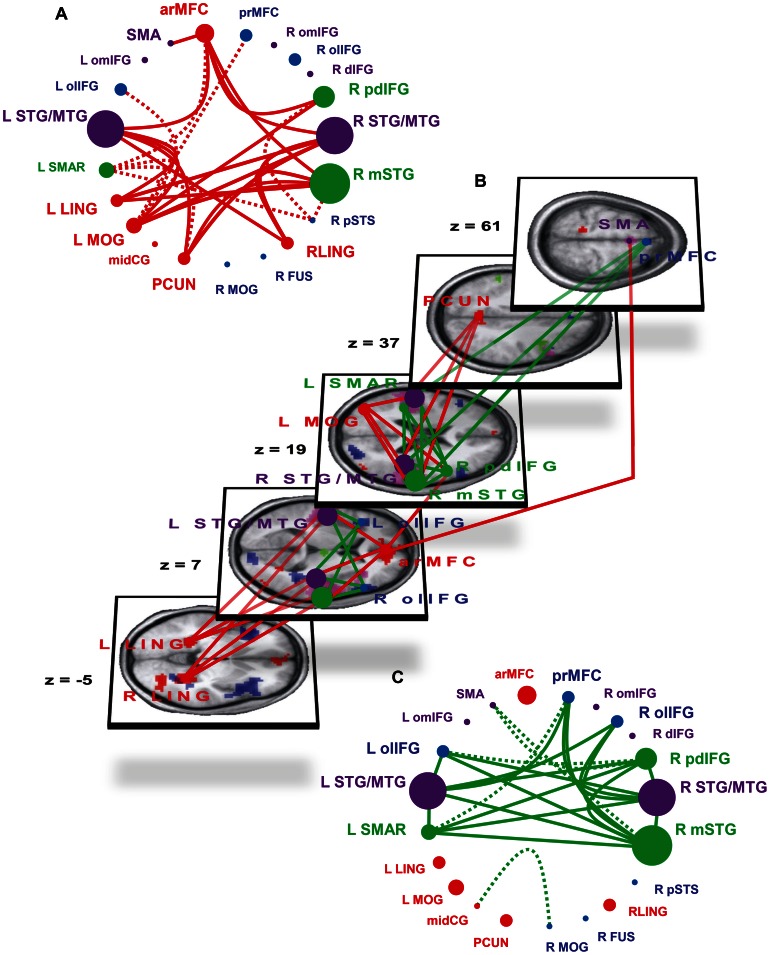
Figure 3. Connectivity modulations within the laughter perception network through complex social laughter types and tickling laughter.
Brain regions with significantly increased responses to CSL (CSL>TIC; red areas/dots), to tickling laughter (TIC>CSL; green areas/dots) and during explicit processing of social information of laughter (CAT>COU; blue areas/dots) as well as regions with equal activation under all experimental conditions (mauve areas/dots) are shown in schematic form (A, C) and superimposed on a three dimensional rendering of five transversal slices of the subjects’ mean anatomic image (B). Increased connectivity during perception of CSL (CSL>TIC; red lines; A and B), and during TIC perception (TIC>CSL; green lines; B and C). Continuous lines: modulations of connectivity which survive correction for multiple comparisons within the target ROI and additional Bonferroni-correction for the number of investigated connections (300). Broken lines: modulations which survive correction for multiple comparisons within the target ROI but not Bonferroni-correction and for which the activated portion of the target ROI is part of a significant target cluster of the whole-brain analysis. Z coordinates refer to the MNI-system. The size of the dots symbolizing the separate ROIs is scaled according to the number of Bonferroni-corrected significant modulations of connectivity of the respective ROI.

