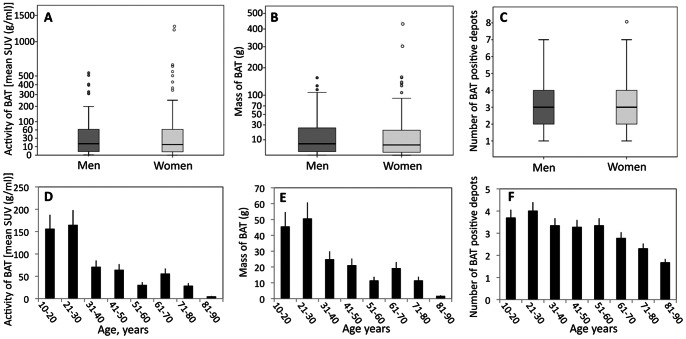
Figure 2. Mass, activity and number of BAT positive depots in men and women and effect of age on the occurrence of BAT.
Panel A shows the mass of BAT in grams. Panel B shows the activity of BAT in grams times the mean SUV value in grams per milliliter. Panel C shows the number of BAT positive depots. The box plots indicate the lower quartile (lower line), median quartile (middle line), upper quartile (upper line), 1.5 times the interquartile range (lower and upper whiskers), and outliers (circles). Patients were divided into decades. The mean ± S.D. of activity (D), mass (E) and number of BAT positive depots (F) in each decade is shown.

