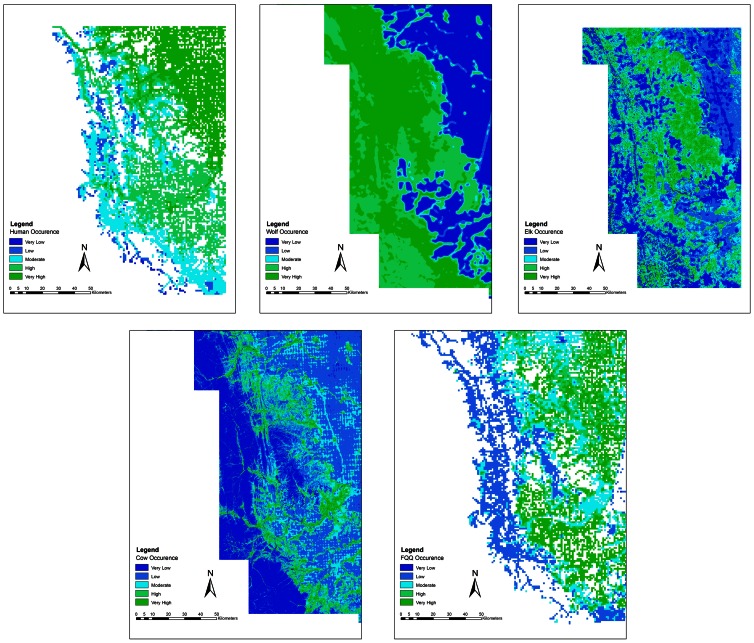
Figure 1. Spatial models of human (top left), wolf (top middle), elk (top right), cattle (bottom left) and forage quality and quantity (FQQ, bottom right) occurrence during the day in southwest Alberta, Canada.
Low values (dark blue to light blue) indicate very low to moderate probability of occurrence at a location whereas high values (light blue to dark green) indicate moderate to very high probability of occurrence.

