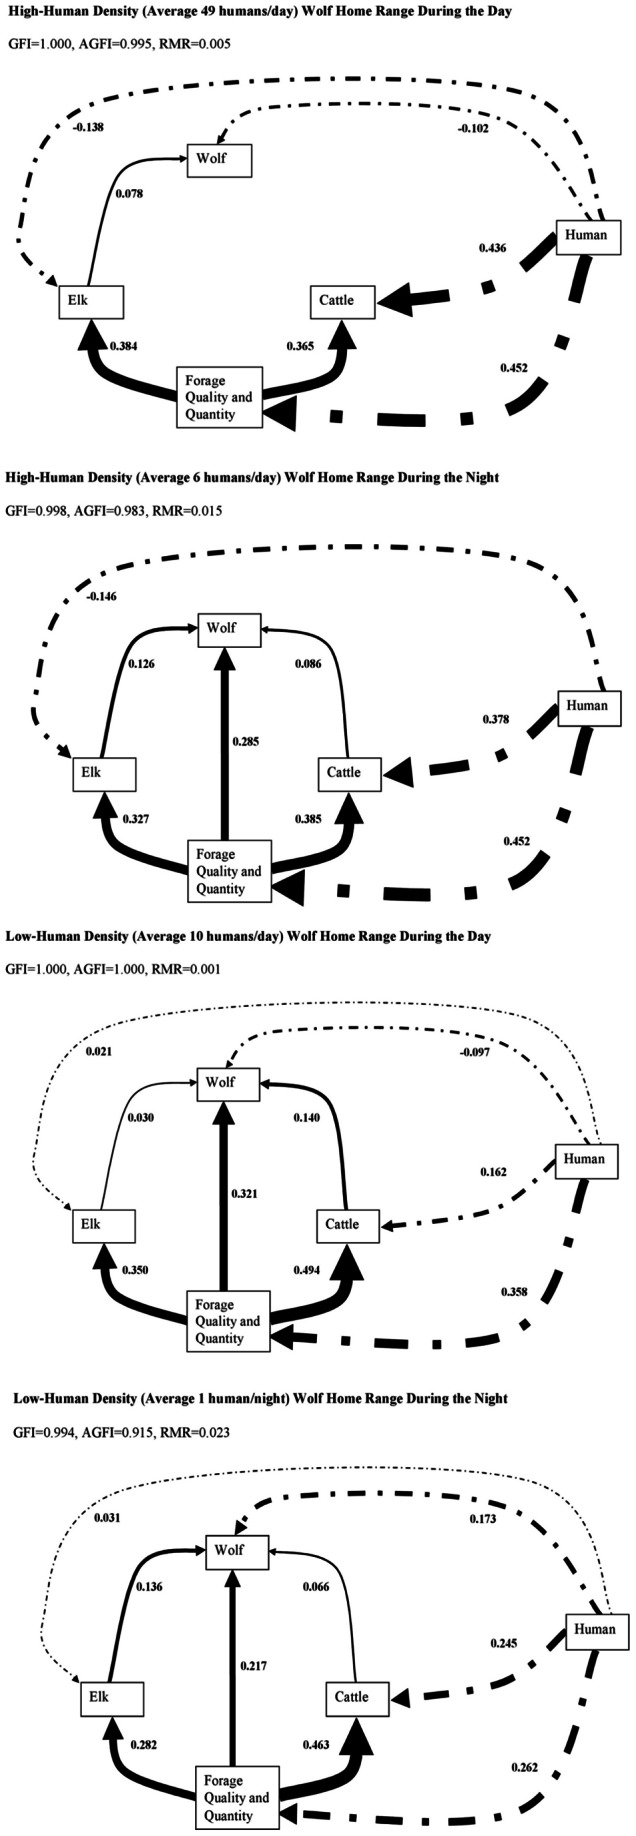
Figure 4. Structural equation model (SEM) illustrating the directions and strengths of relationships among the spatial distribution of humans, wolves, elk, cattle, and forage quality and quantity and forage utilization during the daytime and nighttime within two wolf home ranges with the highest and lowest human density in southwest Alberta, Canada.

.
