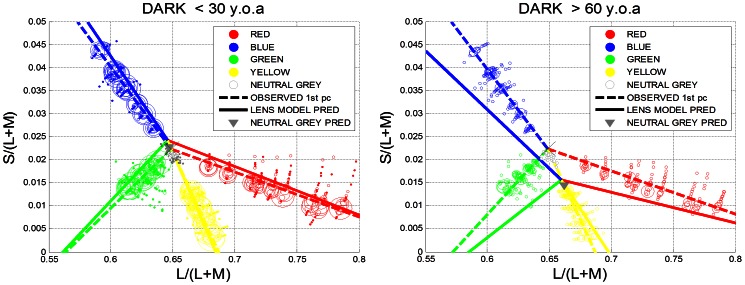
Figure 4. Comparison between the lower (<30 y.o.a.) and the upper age group (>60 y.o.a).
(a) Observed unique hue settings for the dark viewing conditions are shown as circles in Boynton-MacLeod chromaticity diagram for the younger age group (<30 y.o.a). Symbol size is proportional to the number of observations per data point. Dotted lines indicate the observed unique hue lines (summarised by the 1st principal component); the solid lines denote the predicted unique hue lines assuming the lens model by Pokorny et al.. The grey triangle is the average prediction for neutral grey settings, assuming the same lens model. For the younger age group, only very small hue shifts are expected assuming the lens model. All predictions are made with respect to a 32 old observer. (b). For the older age group (>60 y.o.a) large hue shifts are predicted under the lens model. The difference between the observed and predicted hue lines indicates the amount of compensation present in these hue judgements.

