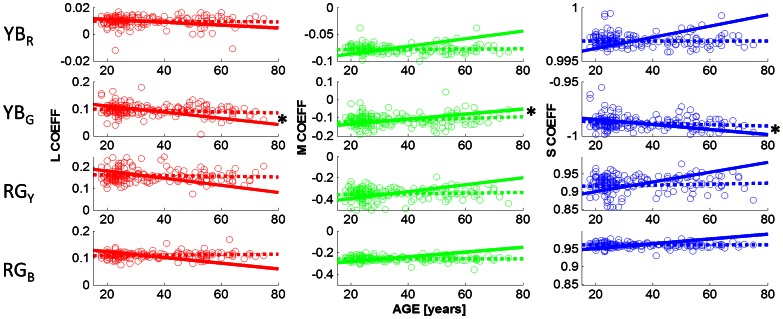
Figure 6. Cone weightings obtained under D65.
Details are as in Figure 3. Under D65, the cone coefficients associated with unique green are age-dependent (p<0.05; for L,M,S cone coefficients). Observed slopes that differ significantly from zero are indicated with a star (*). All predicted slopes are different from zero (p<0.001). The direction of the observed age-related changes (dashed lines; row 2) are predicted by the lens model (solid lines), but not the magnitude (cf Table 1).

