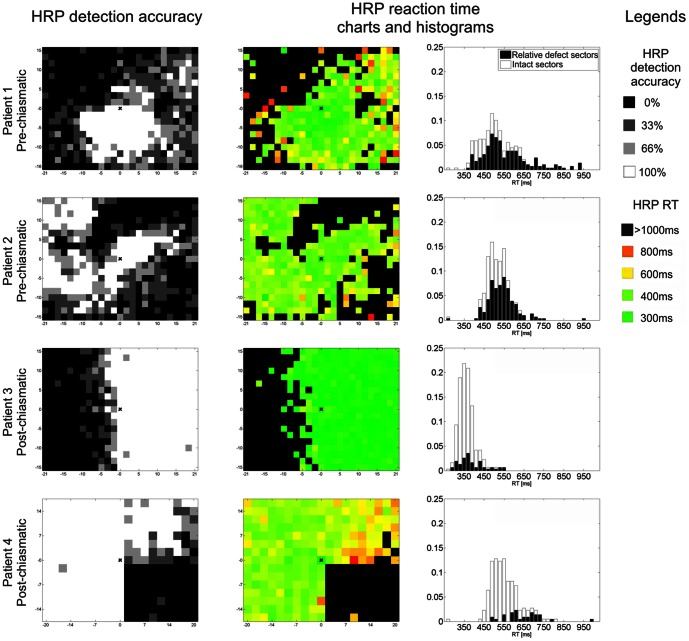
Figure 1. Visual field charts of patients with pre-chiasmatic and post-chiasmatic visual system damage.
Detection accuracy of stimuli presented in high resolution perimetry (HRP), an indicator of functional state (defect depth), is denoted by color: black represents absolute defect (0% detection), grey represents areas of residual vision (relative defect; detection >0% and <100%) and white represents intact field (100% detection). Reaction time (RT) is color-coded in RT charts. RT histograms show the distribution of RT in the HRP sectors defined as intact or relative defect.

