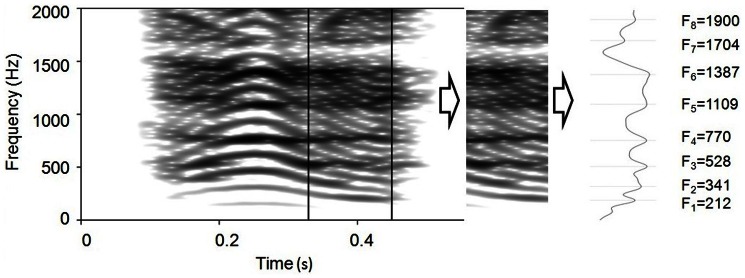
Figure 1. Extraction of the minimum frequency of individual formants in a Iberian deer roar.
A spectrum was computed on the section of the spectrogram where individual formants reach their lowest frequencies. Cepstral smoothing was applied to the spectrum in order to remove the periodicity of the source (F0), thereby highlighting the effect of the filter.

