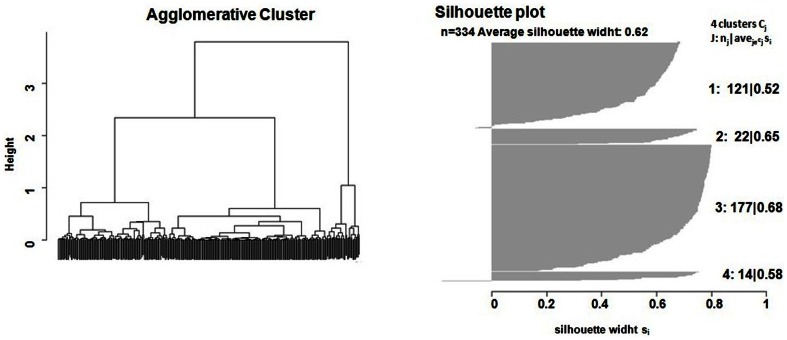
Figure 2. Cluster tree and silhouette plot.
Cluster analysis was used to detect the presence of relatively homogeneous groups of calls. Silhouette Information was computed as a method of cluster interpretation and validation; the highest average silhouette classification score (0.62) was achieved by a four-groups solution based on DC, duration and maximum fundamental frequencies as input variables.

