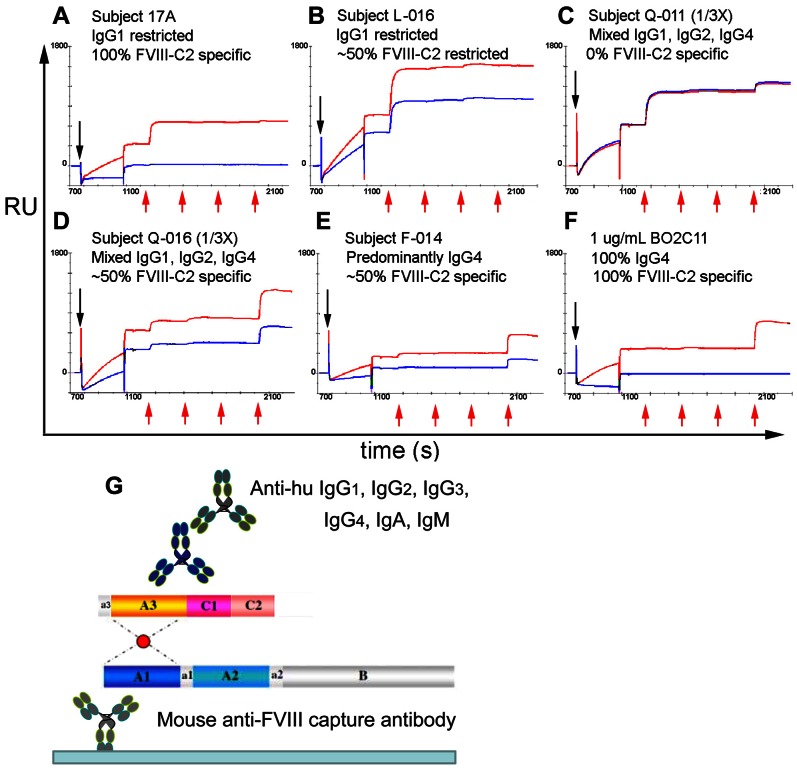
Figure 3. Binding curves from matched plasma samples with and without the addition of saturating (1 µM) recombinant FVIII-C2.
(A–F) Black arrows pointing downwards indicate injection of CA treated plasma and red arrows indicate injections of anti-huIgG1, anti-huIgG2, anti-huIgG3 and anti-huIgG4. Injection of FVIII and its capture on mAb GMA-8004 (0–700 s) are not shown. (G) The Biosensor assay format is shown schematically.

