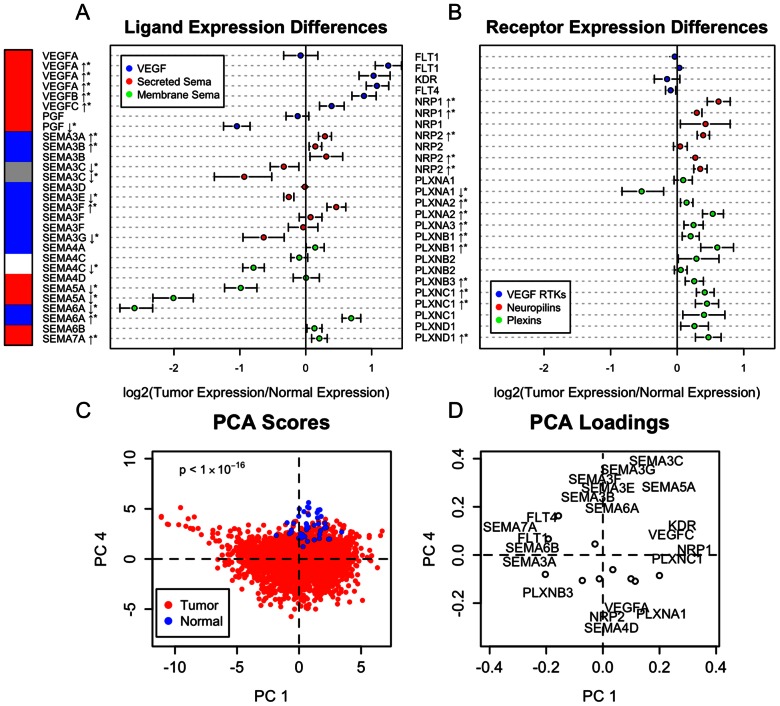
Figure 2. Differences in expression patterns of VEGF- and semaphorin-related genes between normal breast tissue (n = 42) and breast tumors (n = 2,656).
A–B, Differences in mean expression with 99% confidence intervals as determined by the Wilcoxon rank sum test for (A) ligands and (B) receptors at the probe level. Ligands are marked with the following colors to denote known effect on angiogenesis: red for pro-angiogenic, blue for anti-angiogenic, gray for context-dependent (could be pro-or anti-angiogenic) and white for unknown. Genes for which expression is significantly altered in tumors are denoted by * (p<0.001) and the direction noted by an arrow. C–D, Principal component analysis shows separation of tumors from normal samples based on first and second principal component scores (C), with corresponding gene expression patterns given by the loadings for these components (D). Gene labels are only shown for genes whose loading vectors onto PC1 and PC4 exceed a magnitude of 0.23. Circles denote the loading of genes whose names do not appear.

