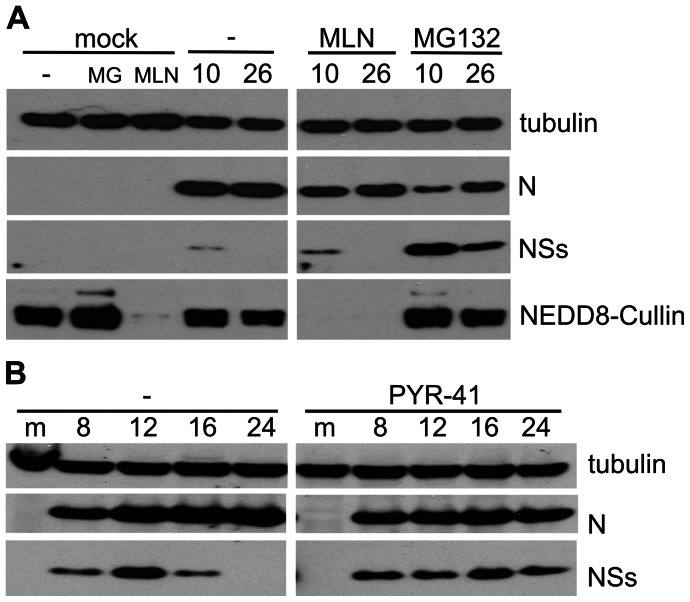
Figure 2. Effect of ubiquitin ligase E3 and E1 inhibitors on NSs degradation.
Cells were infected at 5 PFU/cell and harvested at the indicated times post infection (top of blots) and cell lysates were analysed by immunoblotting using antibodies against the proteins indicated to the right of the panels. (A) Effect of E3 inhibitor. A549 cells were mock-infected or infected with wtBUNV and left untreated (−) or treated with MG132 (10 μM; MG) or MLN4924 (1 µM; MLN) from 5 hpi until harvest. (B) Effect of E1 inhibitor. BHK cells were mock-infected (m) or infected with wtBUNV and left untreated (−) or treated with PYR-41 (50 µM) from 8 hpi.

