
Figure 2. Sequence variant density as the number of randomly-added cultivars increases.
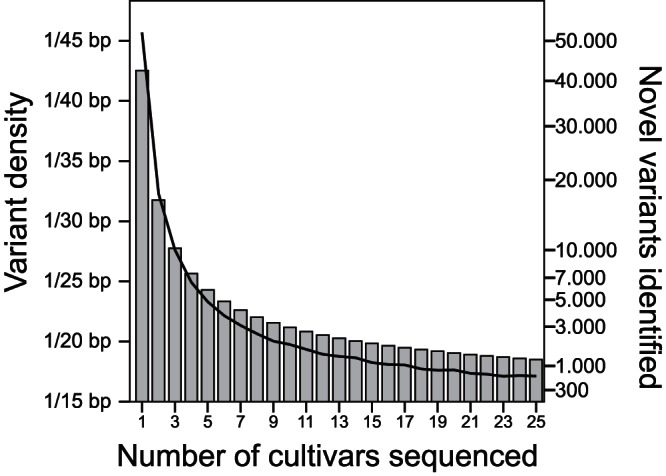
The bars show variant density (primary Y-axis), and the black line shows the number of newly-identified variants (secondary Y-axis) as a function of the number of sequenced cultivars. Data is not shown after the 25th cultivar, but continues to drop to a variant density of 1/16.4 bp and an average of 116 novel variants at the 84th cultivar.