
Figure 6. First and second components from principal component analysis of potato sequence variant genotypes.
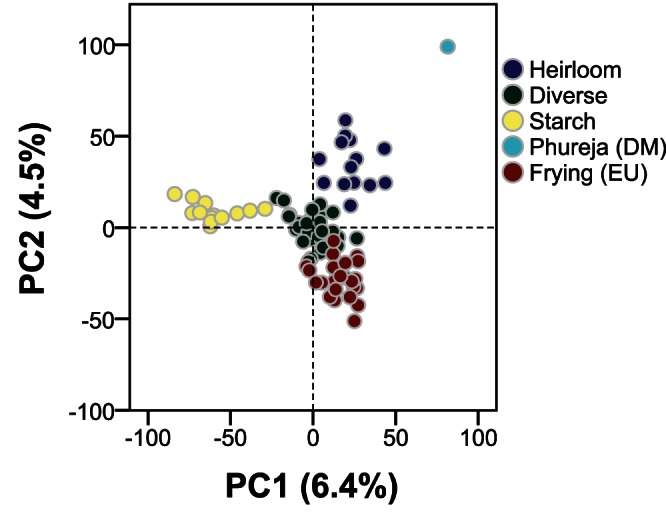
Population structure was analysed using ∼43 K sequence variants genotyped in all 84 cultivars. The first three components describe 14.7% of the variance. Based on these three components, the cultivars were clustered into five groups. The most distant cultivar is the monoploid S. tuberosum Group Phureja clone. In the centre of the PCA plot cultivars of diverse, world-wide origins are observed. Three additional divergent groups can be observed, consisting of heirloom cultivars, frying cultivars from continental Europe and cultivars and germplasm used in starch industry.