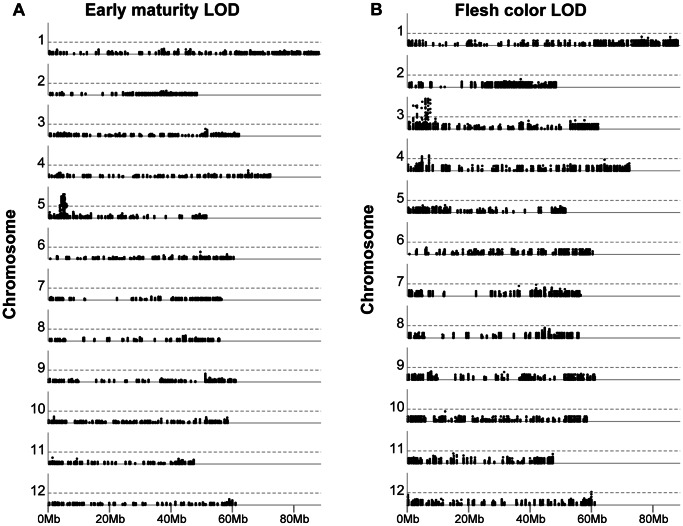
Figure 7. Manhattan plots of p values for associations between DNA sequence variants and two phenotypic traits in potato: (A) plant maturity and (B) tuber flesh colour.
The FDR corrected −log10(p) values from GWAS analysis are plotted relative to the physical position on each of 12 potato chromosomes. The horizontal dashed line is plotted at the FDR-corrected significance threshold of α = 0.001 (−log10(p) = 3).

