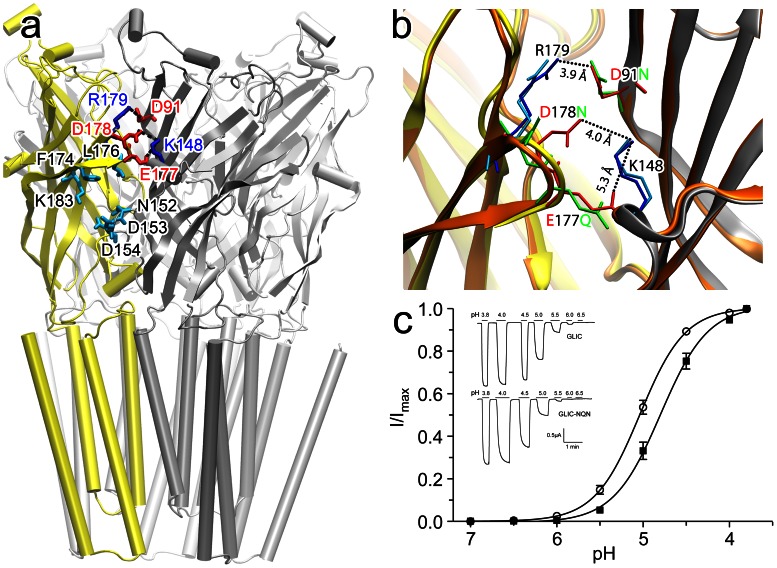
Figure 1. Functionally relevant sites in the EC domain of GLIC.
(a) Residues for the NQN mutation (D91N; E177Q; D178N) and the complementary basic residues (R179 and K148) for salt bridge formation are highlighted in red and blue, respectively. Residues involved in the ketamine binding site (F174, L176, K183; N152, D153, D154) are highlighted in cyan. (b) The C loop region of the crystal structure of the NQN mutant (orange; PDB code: 4IRE), showing an outward movement of the C loop in comparison with the wild type GLIC (yellow and gray; PDB code 4F8H) due to removal of salt bridges in the mutant. R179 and K148 are shown in blue and cyan sticks for GLIC and the NQN mutant respectively. D91N, E177Q, and D178N are shown in red and green sticks, before and after the mutation, respectively. The salt bridge distances in GLIC are highlighted. Note the enlarged gap after the mutation. No hydrogen bonds could be formed for the mutated residues. (c) Two-electrode voltage clamp measurements on Xenopus laevis oocytes expressing the NQN mutant (solid square) and the wild type GLIC (open circle). The half maximal effective concentrations (EC50) for the mutant and GLIC are pH 4.80±0.03 (n = 13) and 5.04±0.02 (n = 10), respectively. The EC50 difference between the wild type GLIC and the NQN mutant is statistically significant (p<0.0001). Error bars represent standard error from the mean. The inserts are the representative traces for GLIC and the NQN mutant.

