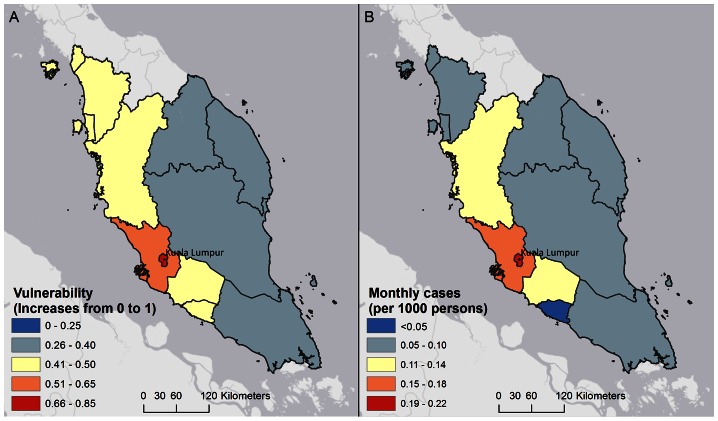
Figure 3. Comparison of vulnerability at state level in December (A) and dengue rates by state in February (B).
These maps compare vulnerability averaged at the state-level (A) with dengue rates per 1000 persons (B), in Malaysia. Average dengue rates during February for even years from 2001 to 2011 are shown as this dataset was used to validate the WADI-Dengue case study. Dengue rates are shown for February because the WADI-Dengue uses a 2 month lag for climate data, based on the exposure thresholds identified in the methods section. Although averaged vulnerability values hide features such as urban areas and mountainous regions, the lower rates of cases observed on the east coast of Malaysia during the monsoon season (November – January) are consistent with the vulnerability profile.

