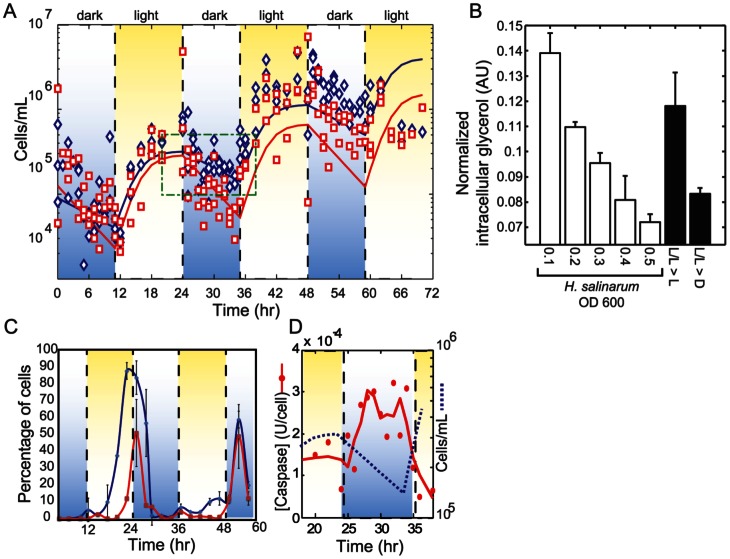
Figure 4. Cell death is triggered at nighttime as part of the diurnal synchronized program of D.salina.
(A) Cell numbers for D. salina in pure and co-cultures with H. salinarum over several diurnal cycles. Live cell concentration measured using flow cytometry are indicated with blue (pure culture) and red (co-culture) points while lines are fitted model simulations. Green boxed region indicates time frame reported in Fig. 3D over which caspase-3 activity was assayed. (B) H. salinarum induces cell death in D. salina under continuous light regime. Intracellular glycerol within D. salina was stained with quinacrine and quantified with flow cytometry. Decrease of intracellular glycerol proportionally with higher cell density of H. salinarum. Unstimulated (pure D. salina culture and dark shifted samples are shown as controls. (L/L>L, cultures grown on a 24 h constant light regime maintained in the light during the measurements, LL>D, cultures grown in constant light shifted to dark conditions (0 µmoles m2s−1). (C) The decrease in D. salina cell number in the model ( Fig. 4A (blue line) due to cell death is supported by the time course of annexin V labeled cells (blue line) indicating percentage of cells exhibiting externalization of PS and SYTOX® blue stained cells indicating the percent dead cells (red line). (D) The decrease in cell number in the model (blue dotted line) due to cell death is also supported by higher levels of caspase-3 during nighttime. Red line is Savitsky-Golay smoothed (span of 5) average of two replicate measurements for each time point.

