
Figure 5. Dependence of dominant distance between head groups across the micelle on alkyl chain length.
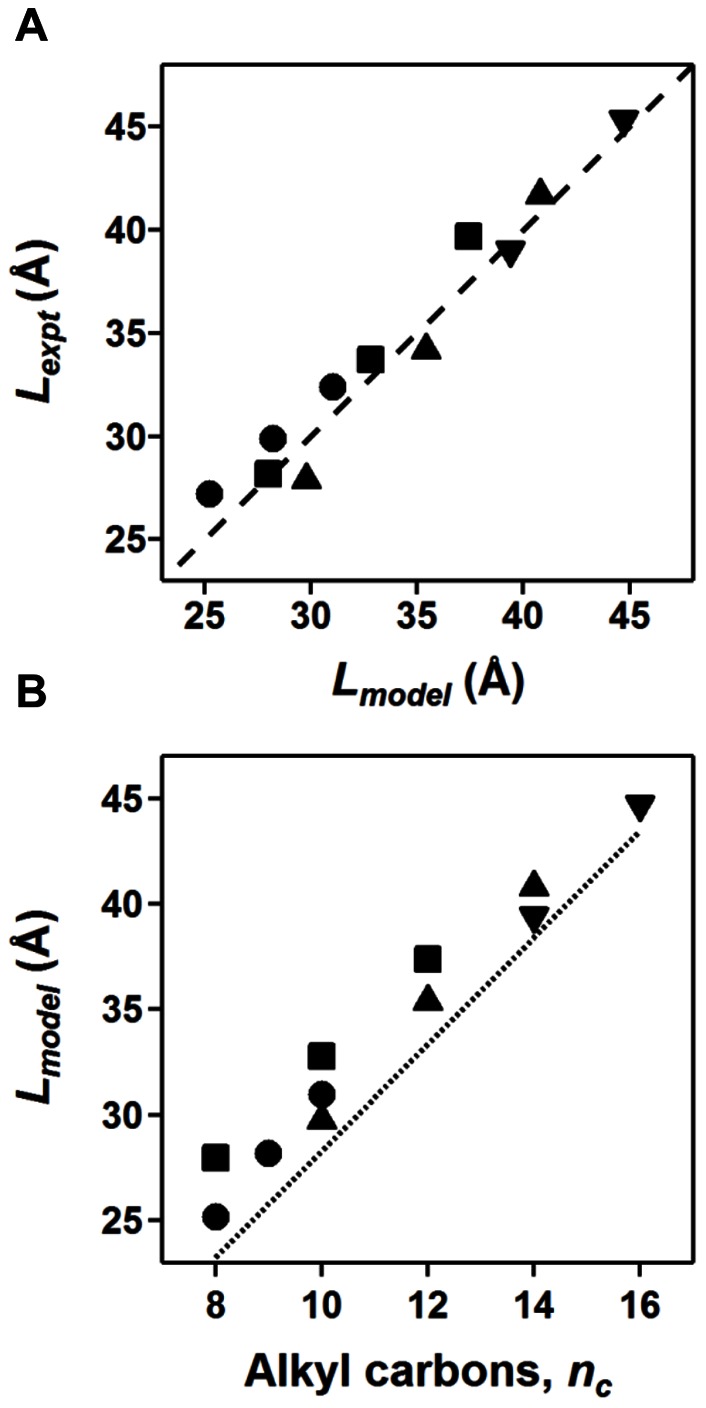
The dominant distances between head groups across the micelle are shown for phosphocholine (▴), glucoside (•), maltoside (▪), and lysophosphatidyl glycerol (▾) detergents. (A) The correlation is shown between the dominant distance determined from the position of the second peak in the experimental SAXS profiles (Lexpt) and the corresponding distance estimated from the model fit (Lmodel). The dashed line represents a perfect correlation between the two approaches. (B) The distance determined from the best model fit for each detergent (Lmodel) is plotted as a function of the number of carbons in the detergent’s alkyl chain (nc). The dotted line represents the distance of two alkyl chains having a fully extended hydrocarbon chain according to Tanford’s formula for alkyl chain length.