
Fig. 1.
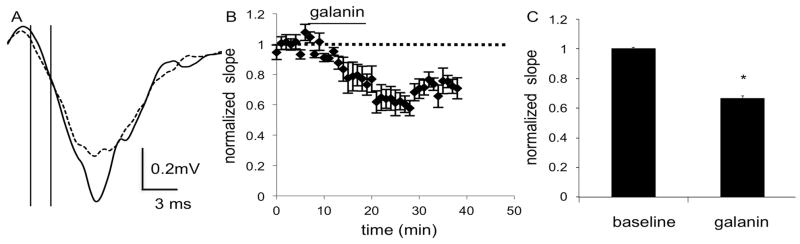
Field recordings in the DS of C57BL/6J mice show a decrease in fEPSPs after application of galanin (100 nM), as seen in A) the average of 4 consecutive traces during the baseline (solid line) and galanin (dashed line) epochs of a representative experiment. The initial slope was calculated using the points at which the vertical lines intersect with the trace. B) The combined normalized amplitudes (n = 6 slices, 6 mice (m)) before and after galanin application and C) the mean of the averaged last five responses of baseline and galanin epochs. Data are expressed as mean ± SEM. *, p<0.05