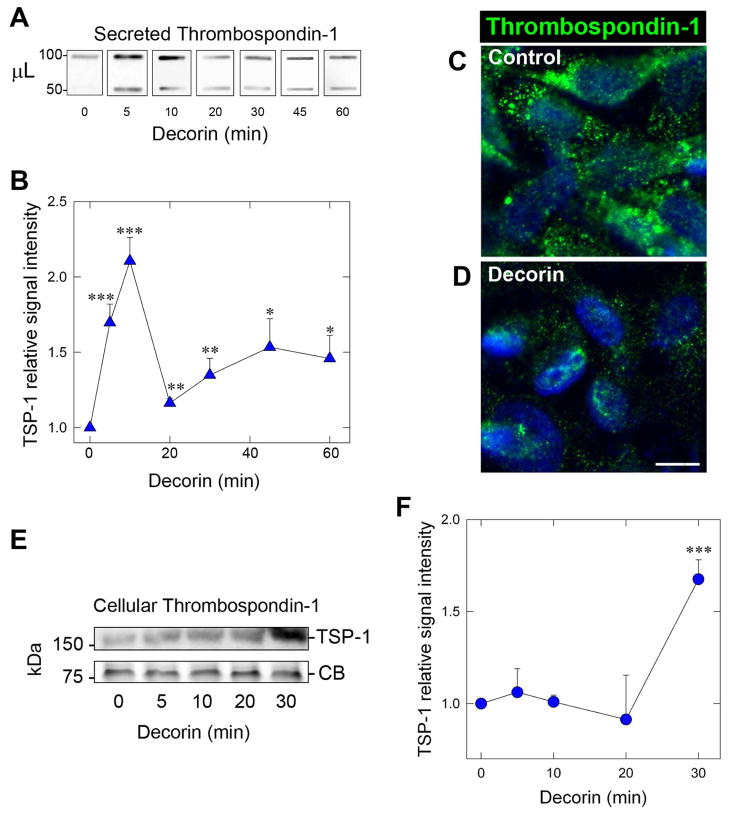
Fig. 1.
Decorin evokes a rapid and biphasic release of Thrombospondin-1 (TSP-1) in MDA-MB-231 breast carcinoma cells. (A) Slot blot analysis of secreted TSP-1 in triple negative breast carcinoma MDA-MB-231 tumor conditioned media following exposure to 200 nM decorin at the indicated time points. Indicated on the left are the volumes of conditioned media in μL. Each sample was diluted with DMEM to reach a constant volume of 400 μL. (B) Quantification of secreted TSP-1 following normalization to total cell number over time. Values represent the mean ±SEM of three independent experiments. *P < 0.05; **P < 0.01; ***P < 0.001. (C,D) Representative confocal images of MDA-MB-231 cells of control (C) or decorin (200 nM, 40 min) treated (D) following immunostaining for TSP-1 (green) or stained with DAPI (blue) to visualize nuclei. Images were captured with the same exposure, gain, and intensity. Bar ~ 10 μm. (E) Immunoblot analysis via SDS-PAGE of cellular TSP-1 following treatment with decorin (200 nM) at the indicated time points. Equal loading of the cell lysates was determined by Coomassie Blue (CB) staining. (F) Immunoblot quantification of cellular TSP-1 at the time intervals reported. Normalization of signal intensities was achieved based on Coomassie blue staining. Slot blots and immunoblots were visualized via HRP-conjugated secondary antibodies. The data are representative of at least 3 independent experiments and reported as fold change ±SEM. *P < 0.05; **P < 0.01; ***P < 0.001 as determined by the Student’s t-test.

