Fig. 2.
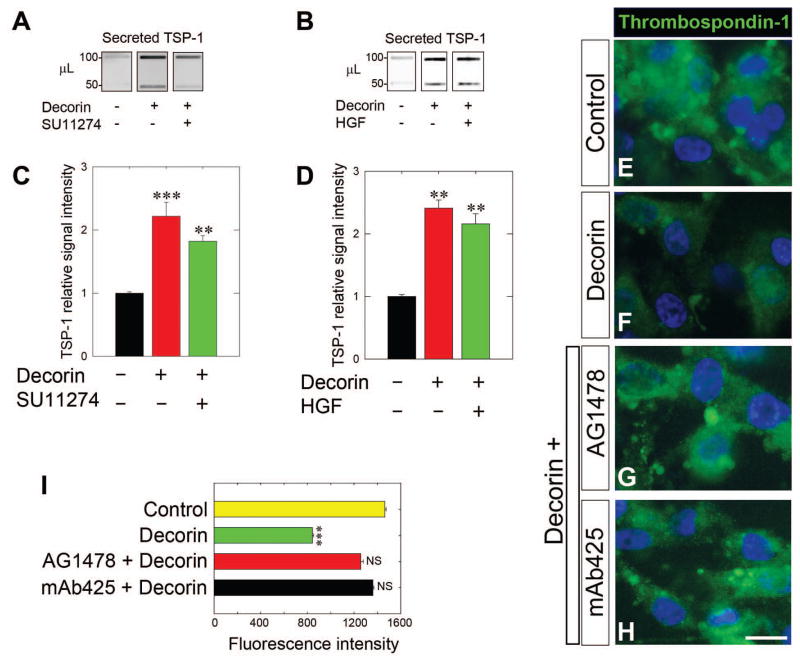
Decorin requires EGFR signaling, but not Met, to evoke rapid TSP-1 release in MDA-MB-231 cells. (A,B) Slot blot analysis of secreted TSP-1 following treatment with either decorin alone (200 nM, 10 min) or in combination with a 30 min pre-treatment with the Met kinase inhibitor SU11274 (1 μM) as in (A) or HGF (50 ng·mL−1) as in (B) followed by a 10 min incubation with decorin (200 nM). (C,D) Quantification of secreted TSP-1 signal intensity following normalization to total cell number for either decorin alone or in combination with SU11274 (C) or HGF (D) pre-treatments. (E–H) Representative immunofluorescence images of TSP-1 (green) in control cells (E), cells treated with 200 nM decorin for 10 min (F), or in conjunction with a 30-min pretreatment with the EGFR kinase inhibitor AG1478 (1 μM, G) or with the EGFR blocking antibody mAb425 (10 μg·mL−1, H) followed by a 10-min decorin treatment (200 nM). All images shown were taken with the same exposure, gain, and intensity. Nuclei appear blue after DAPI staining. Bar ~ 10 μm (I) Average TSP-1 fluorescence intensity was quantified (n = 10/treatment). Data are representative of at least 2–3 independent experiments and reported as normalized fold changes ±SEM (C,D) or as average fluorescence intensity ±SEM (I). **P < 0.01; ***P < 0.001; NS, not significant.

