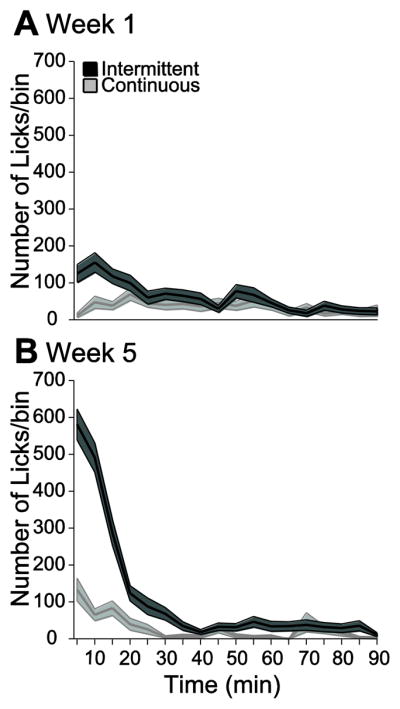
Figure 4. The increase in COS consumption over weeks of intermittent access was concentrated within the first quarter of the session.

The number of licks is plotted against time in 5 min bins for week 1 (A) and week 5 (B) for ICOS and CCOS groups. The shaded region around the lines represents the SEM.
