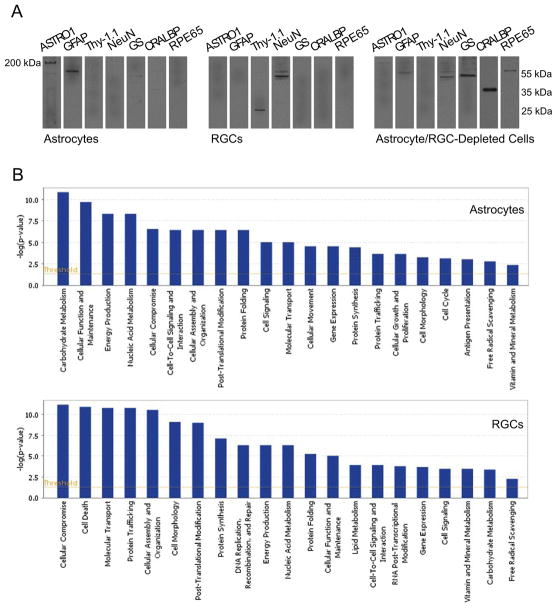
Figure 6.
Cell-specific proteomics analysis of glaucoma. A. Western blot analysis using antibodies to specific cell markers validated enriched samples of retinal astrocytes and RGCs through the immunomagnetic cell isolation process. Only neuronal markers (NeuN and Thy-1.1) were detectable in RGC samples, while astrocyte samples exhibited prominent immunolabeling for astrocyte markers, ASTRO1 and GFAP. Despite faint immunoreactivity of enriched astrocyte samples for GS (a marker for Müller cells) and CRALBP (expressed in Müller cells and retinal pigment epithelium), these samples were negative for RPE65, a marker for retinal pigment epithelium or neuronal markers. Presented data represent three independent sets of analyses with different samples. B. Bioinformatics analysis of the comparative proteomic data by the Ingenuity Pathways Analysis supported distinct responses of astrocytes and RGCs in ocular hypertensive rat eyes. Shown are functional groups of the up-regulated proteins in ocular hypertensive astrocytes and RGCs relative to their controls. While ocular hypertensive samples of RGCs predominantly exhibited stress response and cell death signaling, cellular activation and immune/inflammatory responses were most prominent in ocular hypertensive astrocytes. This figure has recently been published (Tezel et al., 2012c).

