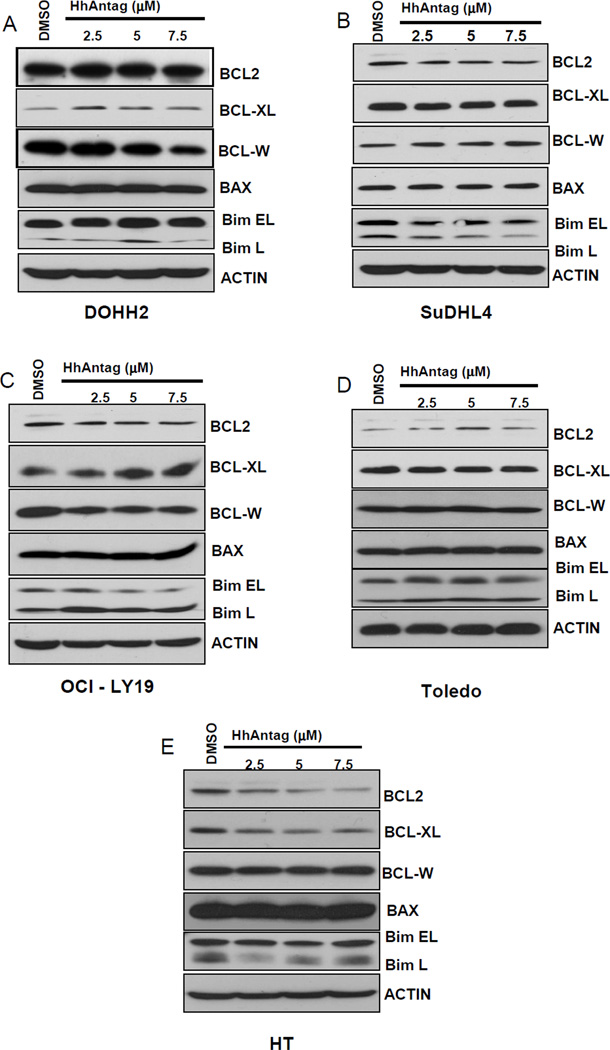
Figure 4. Treatment with increasing concentrations of HhAntag resulted in no changes in the protein levels of BCL2 in those DLBCL cell lines with the t(14;18) but induced a concentration-dependent decrease of BCL2 protein in HT cells, GC cells without the t(14;18).
The basal expression levels of the anti-apoptotic (BCL2, BCL-XL and BCL-W) and pro-apoptotic (BAX, BIM) in the 5 GC-DLBCL cell lines used in the study are shown (A). DOHH2 was the cell line was the highest levels of BCL2 expression and the cell line with the less sensitivity for the SMO inhibitor. Treatment with increasing concentrations of HhAntag resulted in no significant changes in the protein levels of BCL2 in cell lines with the t(14;18) (DOHH2, SuDHL4, OCI-LY19, and Toledo) (B–E). However, treatments with increasing concentrations of HhAntag resulted in decrease in the protein levels of BCL2 in HT cells (F), cells without the t(14;18). No significant changes in the protein expression levels of the anti-apoptotic (BCL-XL and BCL-W) or the pro-apoptotic (BAX, BIM) BCL2 family members were seen after treatments with all concentrations of HhAntag.

