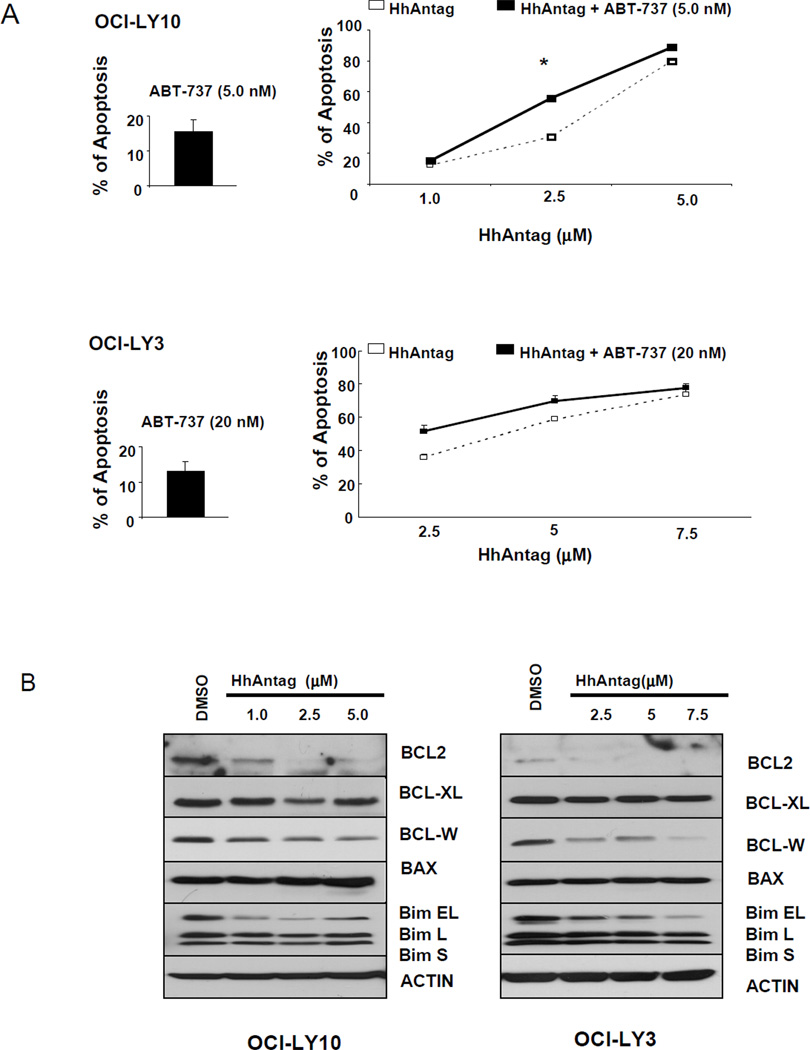
Figure 5. ABC DLBCL cells lines were more sensitive to HhAntag than GC DLBCL cells. HhAntag induced a concentration-dependent decrease of the anti-apoptotic proteins BCL2 and BCL-W in ABC DLBCL cells.
Annexin V and PI labeling assays showed that the beneficial effect of adding fixed IC20 doses of ABT-737 to increasing concentration of HhAntag on the percentage of apoptosis was less pronounced in OCI-LY10 and OCI-LY3 cells than that seen in GC DLBCL cells (A). In contrast to those GC DLBCL cell lines with the t(14;18), treatment with increasing concentrations of HhAntag resulted in decrease of the expression levels of BCL2 and BCL-W in ABC DLBCL cell lines. In contrast to the GC DLBCL cell lines, OCI-LY3 and OCI-LY10 show the shortest form of BIM (BIM S). Three major isoforms of BIM are generated by alternative splicing: BIM EL, BIM L and BIM S [28].

